Calculating Multi-Cloud COGS per Customer: The Executive FinOps Guide to SaaS Gross Margin Protection
Learn how CTOs and CFOs calculate true multi-cloud cost per customer, isolate AI token COGS, and protect SaaS gross margins with automated unit economics.
- Canonical cost normalization across AWS, Azure, GCP, Kubernetes, and LLM APIs into FOCUS 1.0 schema.
- Real-time COGS and gross margin attribution mapped directly to engineering teams and customer tenants.
- Flat monthly pricing with engineer-executed savings automation, avoiding vendor lock-in or savings tax penalties.
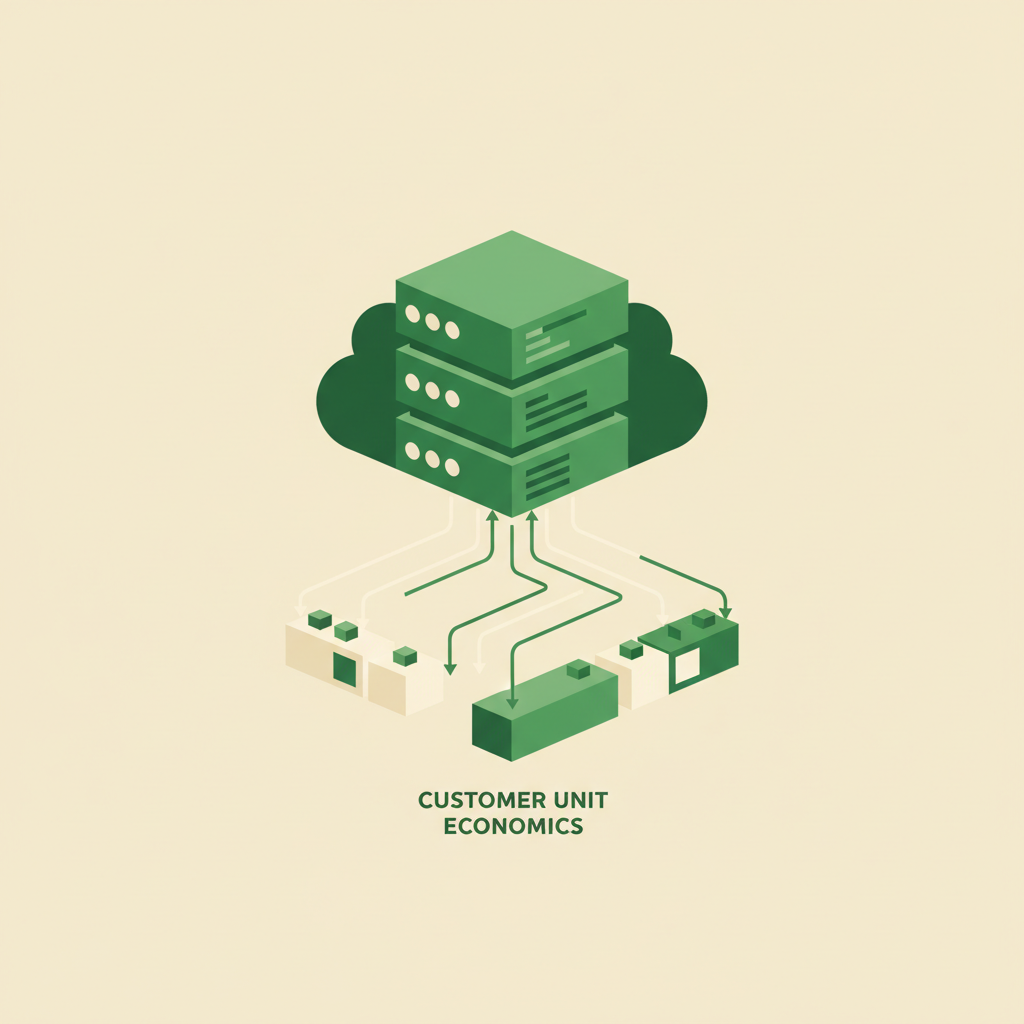
Multi-cloud unit economics is the financial discipline of mapping shared cloud infrastructure, Kubernetes container compute, and AI inference spend directly to discrete business metrics such as cost per customer, cost per API transaction, or cost per tenant. By attributing dynamic cloud consumption directly to Cost of Goods Sold (COGS), engineering and finance leaders isolate unprofitable customer tiers, defend 75%+ SaaS gross margins, and eliminate blind revenue leaks.
The Boardroom Crisis: Why Cloud Spend Must Move from OpEx to Gross Margin Accounting
For enterprise SaaS companies, cloud infrastructure has historically been lumped together as an undifferentiated operational expenditure (OpEx) line item on corporate financial statements. While this accounting shortcut sufficed during growth-at-all-costs macroeconomic cycles, it creates severe blind spots for modern leadership teams.
When cloud compute, managed databases, and multi-tenant AI pipelines scale alongside top-line Annual Recurring Revenue (ARR), aggregate cloud spending naturally increases. However, without granular attribution, Chief Financial Officers (CFOs) and Chief Technology Officers (CTOs) cannot answer foundational investor questions:
- Which enterprise contracts are operating at negative gross margins due to bespoke compute or data retention requirements?
- What is the baseline infrastructure cost to onboard the next 1,000 active tenants?
- How much did recent LLM feature rollouts (OpenAI, Anthropic, or self-hosted vLLM clusters on AWS EKS) increase our marginal cost per customer interaction?
- What portion of cloud expenditure represents true Cost of Goods Sold (production delivery) versus R&D development or internal engineering overhead?
Failing to separate production COGS from non-production engineering spend artificially depresses reported gross margins, directly reducing software company valuation multiples during audit and fundraising rounds.
The Architectural Challenge: The Shared Infrastructure Attribution Problem
Attributing dedicated single-tenant infrastructure (such as an isolated AWS account or dedicated Azure Subscription per client) is trivial. Modern SaaS architectures, however, rely on highly shared, multi-tenant layers designed for elasticity and resource utilization efficiency:
- Multi-Tenant Kubernetes Clusters: Pods from fifty microservices run on shared EKS, GKE, or AKS node pools where CPU and memory pressure fluctuate second-by-second.
- Shared Cloud Databases & Warehouses: Multi-tenant Amazon Aurora clusters, Snowflake data sharing, and DynamoDB tables serve mixed reads and writes without isolated infrastructure boundaries.
- Shared Ingress & Networking: Centralized NAT Gateways, Transit Gateways, and Cloudflare enterprise pipelines route terabytes of inter-service and customer traffic without native tenant tags.
- AI Token Ingestion Pipelines: Centralized inference proxies call OpenAI and Anthropic foundation models, stripping user-level metadata from the raw vendor invoice.
When organizations attempt to solve this in house, they typically spin up brittle spreadsheet reconciliations or build internal data pipelines that fail whenever cloud resource identifiers or tenant identifiers drift.
The Strategic Math: How Legacy FinOps Models Penalize Unit Economics
To achieve unit cost visibility, many engineering organizations evaluate traditional FinOps platforms like CloudZero, Finout, Vantage, or Cloudability. However, the commercial models of legacy platforms directly undermine SaaS unit economics.
Platforms charging a percentage of cloud spend (typically 1% to 3%) or percentage of savings impose an arbitrary tax on operational scale. As your multi-tenant customer base grows and your infrastructure legitimately expands, your FinOps software bill increases in tandem—even when your underlying efficiency metrics remain world-class.
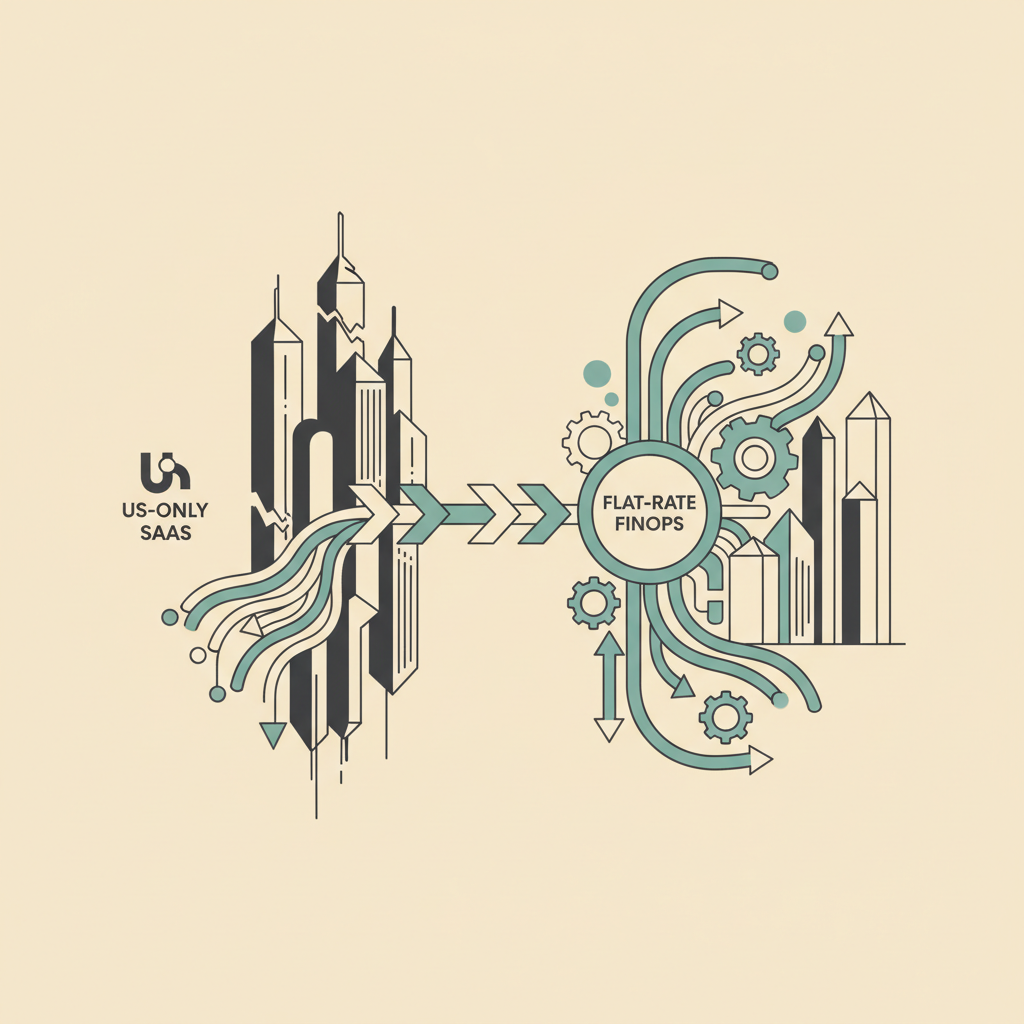
Furthermore, point solutions like Finout routinely gate Unit Economics behind expensive enterprise add-ons (often adding $250 to $500 per month just for business metric ingestion), while charging an additional +25% contract premium for containerized Kubernetes allocation. In contrast, CostGlass delivers native unit cost telemetry, Kubernetes allocation, and multi-cloud normalization for a single, transparent flat monthly fee.
| Evaluation Vector | Traditional SaaS Tools (e.g., CloudZero, Finout, Vantage) | CostGlass Architectural Approach |
|---|---|---|
| Commercial Model | 1%–3% percentage-of-spend or percentage-of-savings tax; annual sales-gated contracts | Predictable flat monthly fee ($0 Free, $99 Starter, $499 Growth, $1,499 Scale); cancel anytime |
| Unit Economics Add-On Fees | Gated behind premium tiers or charged as +$250–$500/mo add-ons | Included natively at $0 extra cost in Growth, Scale, and Enterprise |
| Kubernetes Allocation | Requires separate licensing (+25% fee in Finout) or single-cloud agents | CNCF OpenCost pod/namespace/GPU telemetry built into the unified ledger |
| Data Normalization | Proprietary schemas with 24–48 hour billing latency | Standardized multi-cloud schema refreshed automatically every 6 hours |
| Data Residency & BYOC | Multi-tenant US-only hosting; cloud telemetry leaves customer boundary | Sovereign UK, EU, US, APAC regional cells or 100% In-Account Private AWS (BYOC) |
| Remediation Execution | Passive dashboards; generates Jira tickets that sit unassigned for months | 8+ dedicated senior DevOps/FinOps engineer hours/month on Scale plan to execute fixes |
The In-House Trap: Why Building an Internal Multi-Cloud Cost Pipeline Fails
Faced with rising cloud invoices and board-level pressure to defend SaaS gross margins, engineering teams frequently consider building their own multi-cloud cost aggregation pipelines and internal SQL models. On paper, it sounds straightforward: write ETL scripts to ingest AWS CUR 2.0, Azure MCA, Google Cloud BigQuery exports, Kubernetes pod metrics, and OpenAI API logs into an internal data warehouse.
In practice, attempting to build and maintain an internal multi-cloud FinOps pipeline is one of the most expensive architectural traps an engineering organization can fall into:
- Continuous Schema & API Drift: Cloud providers constantly revise billing formats, discount line items, and commitment structures (such as SavingsPlanNegation or Azure reservation amortizations). A pipeline that works today breaks next month, requiring constant engineering attention.
- The Maintenance Tax on Engineering Velocity: Maintaining cross-cloud data pipelines, reconciliation scripts, and custom dashboards pulls senior platform engineers away from shipping customer-facing features and core product roadmap items. A company can easily burn $150,000+ in annual engineering salaries just maintaining internal dashboards that lag 48 hours behind reality.
- The Shared Infrastructure Blind Spot: Writing bespoke SQL to allocate shared Kubernetes clusters, Aurora read replicas, NAT Gateways, and AI token proxies across hundreds of dynamic tenants requires constant refactoring. Without automated virtual tagging and automated de-duplication, internal figures quickly diverge from the actual cloud invoices.
- Zero Execution or Remediation: Even if an internal dashboard accurately calculates cost per tenant, it cannot fix anything. It produces passive charts rather than automated off-hours scheduling, rightsizing execution, or commitment governance.
This is precisely why high-performing CTOs and CFOs choose a dedicated, turnkey platform: buying an established solution delivers instant audit-ready accuracy without draining engineering bandwidth.
How to Configure & Automate Unit Economics in CostGlass
Rather than engineering, maintaining, and updating custom SQL queries as cloud providers adjust billing export schemas, CostGlass automates unit cost allocation through intuitive platform workflows.
Step 1: Connect Your Cloud, Container, and AI Providers
Follow the step-by-step guides in the CostGlass Connection Overview to integrate your infrastructure via read-only, least-privilege IAM roles and service principals:
- Multi-Cloud Billing: Configure AWS via CloudFormation or Terraform with automated CUR 2.0 ingestion, Microsoft Azure, and Google Cloud.
- Kubernetes Pod Allocation: Deploy the lightweight CNCF OpenCost exporter per cluster as detailed in Kubernetes Costs.
- AI & Observability APIs: Add OpenAI, Anthropic, and Snowflake read-only API credentials under SaaS & AI Spend Tracking.
Step 2: Classify COGS with Virtual Tagging v2
Shared databases, unallocated nodes, and legacy resources often lack clean cloud-level tags. Instead of forcing your platform team to refactor Terraform and trigger state drift across production environments, navigate to Virtual Tagging (#finops:virtual-tags).
- Define a Virtual Tag named
VTAG:FinancialBucket. - Create a rule mapping all accounts tagged
env=prod, along with designated production EKS clusters and OpenAI organization keys, toCOGS_Production. - Map test accounts, sandbox VPCs, and Datadog staging endpoints to
OpEx_Research_And_Development. - CostGlass compiles your rules directly into an indexed SQL engine, retroactively categorizing 100% of untagged historical infrastructure without modifying a single live cloud resource.
Step 3: Define Custom Business Volume Metrics
Navigate to Unit Economics (#finops:unit-economics) and connect your business volume telemetry:
- Define unit denominator metrics (e.g., Monthly Active Tenants, Processed Transactions, or 1k Model Tokens Ingested) via API or manual monthly CSV upload.
- Bind the denominator to your
COGS_Productionspend scope. - Configure automated threshold alerts to notify your engineering channel via Slack or Microsoft Teams whenever a specific customer tier's unit cost drifts upward by more than 5% week-over-week.
Step 4: Export Board-Ready Margin Reports
From the Executive Reports Library (#finops:reports), generate audit-ready, like-for-like month-to-date (MTD) financial summaries. Export native Excel (.xlsx), CSV, and PDF board packs showing your SaaS gross margin breakdown, cost-per-customer distribution, and production infrastructure efficiency.
The CostGlass Advantage: Embedded Engineering Execution
Traditional FinOps tools conclude their workflow by surfacing a chart showing that customer cost per request has doubled. They leave the remediation burden entirely on your engineering teams, adding hundreds of Jira tickets to an already overwhelmed backlog.
For growing organizations without dedicated FinOps staff, CostGlass pairs software intelligence with real human engineering capability. Under the CostGlass Scale Plan, clients receive 8+ dedicated senior DevOps and FinOps engineer-hours every single month.
Our engineers do not simply generate recommendations—they execute them on your behalf. Whether you need to rightsize over-provisioned EKS node pools, configure multi-cloud start/stop instance schedules (cg-schedule), eliminate idle NAT Gateways, or structure zero-drift Terraform PRs, CostGlass delivers measurable bottom-line savings while keeping your internal engineering teams focused on shipping product.
Frequently Asked Questions
How does unit economics differ between single-tenant and multi-tenant SaaS?
Single-tenant SaaS environments deploy dedicated cloud accounts, VPCs, or subscriptions for each client, making direct billing attribution straightforward through account-level rollups. Multi-tenant SaaS environments run hundreds of customers concurrently on shared compute, database clusters, and Kubernetes node pools. In multi-tenant systems, unit economics requires combining normalized billing records with application telemetry (like request volume, pod CPU time, or database query counts) to attribute shared costs accurately.
Can CostGlass track OpenAI and Anthropic API spend on a per-customer basis?
Yes. By combining CostGlass's native SaaS/AI connectors (which ingest model-level usage, prompt/completion tokens, and Batch API discounts every 6 hours) with application-level API proxy logs or Virtual Tags, CostGlass attributes generative AI inference costs directly into your tenant unit economics reports. This prevents LLM token usage from silently eroding your software gross margins.
How does CostGlass protect sovereign billing data for regulated enterprises?
CostGlass provides sovereign regional data residency cells located in the United Kingdom (eu-west-2), European Union (eu-central-1), United States (us-east-1), and Asia-Pacific (ap-southeast-1). For financial services, healthcare, or defense organizations subject to strict compliance mandates, CostGlass also offers an Enterprise Bring-Your-Own-Cloud (BYOC) deployment model, running the entire serverless analytics engine privately inside your own AWS account and VPC so zero financial telemetry leaves your cloud perimeter.
Ready to protect your SaaS gross margins and gain board-ready unit cost clarity across AWS, Azure, GCP, Kubernetes, and AI? Explore CostGlass Transparent Pricing, review our FinOps Competitor Comparison Playbook, or learn how to connect your multi-cloud environment in minutes with our Unit Economics Setup Guide.
La economía unitaria multi-cloud (unit economics) es la disciplina financiera que vincula la infraestructura cloud compartida, la computación de contenedores en Kubernetes y el gasto en inferencia de IA directamente con métricas de negocio específicas, tales como el coste por cliente, el coste por transacción de API o el coste por tenant. Al atribuir el consumo dinámico de la nube directamente al Coste de los Bienes Vendidos (COGS, por sus siglas en inglés), los líderes de ingeniería y finanzas pueden aislar los segmentos de clientes no rentables, defender márgenes brutos SaaS superiores al 75% y erradicar fugas de ingresos invisibles.
La crisis en el consejo de administración: Por qué el gasto cloud debe pasar de OpEx a la contabilidad de margen bruto
En las empresas de software SaaS empresariales, la infraestructura en la nube se ha consolidado históricamente como una partida operativa indistinta (OpEx) en los estados financieros corporativos. Si bien este atajo contable funcionó durante los ciclos macroeconómicos de «crecimiento a toda costa», hoy genera graves puntos ciegos para los equipos directivos.
Cuando el cómputo en la nube, las bases de datos administradas y los pipelines de IA multi-tenant escalan en paralelo a los Ingresos Recurrentes Anuales (ARR), el gasto agregado en la nube se incrementa de forma natural. Sin embargo, en ausencia de una atribución granular, los Directores Financieros (CFOs) y los Directores de Tecnología (CTOs) no pueden responder a preguntas fundamentales de los inversores:
- ¿Qué contratos empresariales operan con márgenes brutos negativos debido a requisitos específicos de computación o retención de datos?
- ¿Cuál es el coste base de infraestructura necesario para dar de alta a los próximos 1.000 clientes activos?
- ¿En qué medida los recientes lanzamientos de funciones con LLM (OpenAI, Anthropic o clusters vLLM autohospedados en AWS EKS) han elevado nuestro coste marginal por interacción con el cliente?
- ¿Qué proporción del gasto en la nube representa auténtico Coste de los Bienes Vendidos (prestación del servicio en producción) frente a I+D o sobrecostes internos de ingeniería?
No separar el COGS de producción del gasto de ingeniería ajeno a la producción reduce artificialmente los márgenes brutos reportados, lo que deprime de forma directa los múltiplos de valoración de la compañía en auditorías y rondas de financiación.
El reto arquitectónico: El problema de atribución en infraestructuras compartidas
Atribuir infraestructura dedicada a un único cliente (single-tenant), como una cuenta de AWS aislada o una suscripción dedicada de Azure por cliente, es trivial. Sin embargo, las arquitecturas SaaS modernas se basan en capas multi-tenant altamente compartidas, diseñadas para maximizar la elasticidad y la eficiencia en el uso de los recursos:
- Clusters de Kubernetes multi-tenant: Pods correspondientes a cincuenta microservicios conviven en grupos de nodos (node pools) compartidos de EKS, GKE o AKS, donde la demanda de CPU y memoria fluctúa segundo a segundo.
- Bases de datos y almacenes de datos compartidos: Clusters multi-tenant de Amazon Aurora, intercambio de datos en Snowflake y tablas de DynamoDB gestionan lecturas y escrituras mixtas sin límites de infraestructura aislados.
- Ingress y redes compartidas: NAT Gateways centralizados, Transit Gateways y canalizaciones empresariales de Cloudflare enrutan terabytes de tráfico entre servicios y clientes sin etiquetas nativas de tenant.
- Pipelines de ingesta de tokens de IA: Proxies centralizados de inferencia realizan llamadas a modelos fundacionales de OpenAI y Anthropic, eliminando los metadatos de usuario de la factura en bruto del proveedor.
Cuando las organizaciones intentan resolver esto de forma interna, suelen recurrir a frágiles conciliaciones en hojas de cálculo o a canalizaciones de datos internas que se rompen cada vez que cambian los identificadores de recursos en la nube o los identificadores de cliente.
La matemática estratégica: Cómo penalizan la economía unitaria los modelos FinOps tradicionales
Para conseguir visibilidad sobre los costes unitarios, muchas organizaciones de ingeniería evalúan plataformas de FinOps tradicionales como CloudZero, Finout, Vantage o Cloudability. Sin embargo, los modelos comerciales de las plataformas tradicionales perjudican de forma directa la economía unitaria del SaaS.
Las plataformas que cobran un porcentaje del gasto cloud (normalmente entre el 1% y el 3%) o un porcentaje de los ahorros conseguidos imponen un gravamen arbitrario a su escala operativa. A medida que su base de clientes multi-tenant crece y su infraestructura se expande legítimamente, la factura de su software de FinOps aumenta en consecuencia, incluso si sus métricas de eficiencia subyacentes son excelentes.
Asimismo, soluciones puntuales como Finout restringen habitualmente la funcionalidad de Unit Economics tras costosos complementos empresariales (a menudo sumando entre $250 y $500 mensuales solo por la ingesta de métricas de negocio), cobrando además un recargo contractual del +25% por la asignación de contenedores en Kubernetes. Por el contrario, CostGlass proporciona telemetría nativa de costes unitarios, asignación de Kubernetes y normalización multi-cloud bajo una tarifa plana mensual única y transparente.
| Vector de evaluación | Herramientas SaaS tradicionales (ej. CloudZero, Finout, Vantage) | Enfoque arquitectónico de CostGlass |
|---|---|---|
| Modelo comercial | Gravamen del 1%–3% sobre el gasto o porcentaje de ahorro; contratos anuales sujetos a ventas | Tarifa plana mensual predecible ($0 Free, $99 Starter, $499 Growth, $1,499 Scale); cancele en cualquier momento |
| Costes adicionales por Unit Economics | Restringido a planes premium o cobrado como complementos de +$250–$500/mes | Incluido de forma nativa sin coste adicional en Growth, Scale y Enterprise |
| Asignación de Kubernetes | Requiere licencias independientes (tarifa de +25% en Finout) o agentes específicos por nube | Telemetría de pods, namespaces y GPUs con CNCF OpenCost integrada en el libro mayor unificado |
| Normalización de datos | Esquemas propietarios con una latencia de facturación de 24 a 48 horas | Esquema multi-cloud estandarizado con actualización automática cada 6 horas |
| Residencia de datos y BYOC | Alojamiento multi-tenant exclusivo en EE. UU.; la telemetría sale del perímetro de la empresa | Células soberanas en UK, EU, US y APAC o despliegue 100% In-Account Private AWS (BYOC) |
| Ejecución de remediaciones | Paneles pasivos; generan tickets de Jira que permanecen desatendidos durante meses | Más de 8 horas mensuales dedicadas de ingenieros senior de DevOps/FinOps en el plan Scale para ejecutar correcciones |
La trampa interna: Por qué fracasa la construcción de un pipeline multi-cloud propio
Ante el aumento de las facturas en la nube y la exigencia del consejo de administración de proteger los márgenes brutos SaaS, muchos equipos de ingeniería se plantean construir internamente sus propios pipelines de costes y modelos SQL. En apariencia parece simple: crear scripts ETL para ingestar AWS CUR 2.0, Azure MCA, BigQuery de GCP, métricas de Kubernetes y logs de OpenAI en un almacén de datos interno.
En la práctica, construir y mantener un pipeline interno de FinOps multi-cloud es una de las trampas más costosas para cualquier organización técnica:
- Desviación continua de esquemas y APIs: Los proveedores de nube actualizan con frecuencia sus formatos de facturación, conceptos de descuento y estructuras de compromisos. Un pipeline que funciona hoy se rompe el mes que viene, exigiendo mantenimiento constante.
- Un peaje inasumible sobre la velocidad de entrega: Mantener scripts de sincronización y conciliación desvía a ingenieros senior del desarrollo del producto principal. Las empresas terminan quemando más de 150.000 $ anuales en salarios técnicos solo para mantener cuadros de mando internos con 48 horas de retraso.
- El punto ciego de la infraestructura compartida: Escribir consultas SQL a medida para repartir clusters de Kubernetes, réplicas de bases de datos y pasarelas de red entre cientos de clientes exige refactorizaciones continuas. Sin etiquetado virtual automatizado, las cifras internas divergen de las facturas reales.
- Cero capacidad de remediación: Un desarrollo propio solo muestra gráficos pasivos, pero no aplica apagados programados automáticos, derechos de tamaño (rightsizing) ni ejecución de compras de compromisos.
Por esta razón, los CTOs y CFOs experimentados eligen una plataforma llave en mano: adoptar CostGlass proporciona precisión inmediata y lista para auditorías sin hipotecar el tiempo de sus ingenieros.
Cómo configurar y automatizar la economía unitaria en CostGlass
En lugar de diseñar, mantener y actualizar consultas SQL personalizadas a medida que los proveedores de nube alteran sus esquemas de exportación de facturación, CostGlass automatiza la asignación de costes unitarios mediante flujos de trabajo integrados en la plataforma.
Paso 1: Conecte sus proveedores de nube, contenedores e IA
Siga las guías paso a paso de la visión general de conexión de CostGlass para integrar su infraestructura mediante roles IAM de mínimos privilegios y solo lectura, así como directores de servicio:
- Facturación multi-cloud: Configure AWS mediante CloudFormation o Terraform con ingesta automatizada de CUR 2.0, Microsoft Azure y Google Cloud.
- Asignación de pods en Kubernetes: Despliegue el exportador ligero CNCF OpenCost en cada cluster según se detalla en costes de Kubernetes.
- APIs de IA y observabilidad: Agregue credenciales de API de solo lectura de OpenAI, Anthropic y Snowflake en seguimiento de gasto en SaaS e IA.
Paso 2: Clasifique el COGS con Virtual Tagging v2
Las bases de datos compartidas, los nodos no asignados y los recursos heredados suelen carecer de etiquetas precisas a nivel de nube. En lugar de obligar al equipo de plataforma a refactorizar Terraform y provocar discrepancias de estado (state drift) en entornos de producción, acceda a Virtual Tagging (#finops:virtual-tags).
- Defina un Virtual Tag con el nombre
VTAG:FinancialBucket. - Cree una regla que asigne todas las cuentas etiquetadas como
env=prod, junto con los clusters de EKS de producción designados y las claves de organización de OpenAI, aCOGS_Production. - Asigne las cuentas de prueba, las VPCs de sandbox y los endpoints de staging de Datadog a
OpEx_Research_And_Development. - CostGlass compila sus reglas directamente en un motor SQL indexado, categorizando de forma retroactiva el 100% de la infraestructura histórica no etiquetada sin modificar un solo recurso activo en la nube.
Paso 3: Defina métricas personalizadas de volumen de negocio
Diríjase a Unit Economics (#finops:unit-economics) y conecte la telemetría operativa de su aplicación:
- Defina las métricas de denominador unitario (p. ej., Clientes Activos Mensuales, Transacciones Procesadas o miles de Tokens Ingeridos) mediante API o carga manual mensual de archivos CSV.
- Vincule el denominador al alcance de gasto correspondiente a
COGS_Production. - Configure alertas de umbral automatizadas para notificar a su canal de ingeniería en Slack o Microsoft Teams siempre que el coste unitario de un segmento de clientes aumente más de un 5% semana tras semana.
Paso 4: Exporte informes de márgenes listos para el consejo de administración
Desde la biblioteca de informes ejecutivos (#finops:reports), genere resúmenes financieros mensuales comparables (MTD) listos para auditoría. Exporte paquetes para el consejo en formatos nativos de Excel (.xlsx), CSV y PDF que reflejen el desglose de márgenes brutos SaaS, la distribución de costes por cliente y la eficiencia de la infraestructura en producción.
La ventaja de CostGlass: Ejecución técnica de ingeniería integrada
Las herramientas tradicionales de FinOps concluyen su flujo de trabajo mostrando un gráfico que indica que el coste por petición de un cliente se ha duplicado. Dejan la carga de la resolución íntegramente en manos de sus equipos de ingeniería, saturando el backlog con cientos de tickets de Jira sin resolver.
Para las organizaciones en crecimiento que no cuentan con personal de FinOps dedicado, CostGlass combina inteligencia de software con capacidad real de ingeniería humana. En el Plan Scale de CostGlass, los clientes reciben más de 8 horas mensuales dedicadas de ingenieros senior de DevOps y FinOps.
Nuestros ingenieros no se limitan a generar recomendaciones: las ejecutan por usted. Ya sea para redimensionar grupos de nodos sobredimensionados en EKS, configurar programaciones de encendido/apagado de instancias multi-cloud (cg-schedule), eliminar NAT Gateways inactivos o estructurar Pull Requests de Terraform sin drift, CostGlass genera ahorros medibles en su cuenta de resultados mientras sus equipos internos se concentran en desarrollar producto.
Preguntas frecuentes
¿En qué se diferencia la economía unitaria entre un modelo SaaS single-tenant y uno multi-tenant?
Los entornos SaaS single-tenant despliegan cuentas de nube, VPCs o suscripciones dedicadas para cada cliente, lo que simplifica la atribución directa en la facturación mediante agregaciones a nivel de cuenta. Los entornos SaaS multi-tenant ejecutan cientos de clientes simultáneamente sobre capas compartidas de computación, clusters de bases de datos y grupos de nodos de Kubernetes. En sistemas multi-tenant, la economía unitaria requiere cruzar los registros de facturación normalizados con la telemetría de la aplicación (como el volumen de peticiones, el tiempo de CPU por pod o las consultas a bases de datos) para distribuir con exactitud los costes compartidos.
¿Puede CostGlass supervisar el gasto de las APIs de OpenAI y Anthropic por cliente?
Sí. Al combinar los conectores nativos de SaaS e IA de CostGlass (que extraen el consumo por modelo, tokens de entrada/salida y descuentos de Batch API cada 6 horas) con los logs de proxies de API a nivel de aplicación o con Virtual Tags, CostGlass asigna los costes de inferencia de IA generativa directamente en los informes de economía unitaria de cada cliente. Esto evita que el consumo de tokens de LLM erosione en silencio los márgenes brutos del software.
¿Cómo protege CostGlass los datos de facturación soberanos en empresas reguladas?
CostGlass ofrece células regionales soberanas para la residencia de datos situadas en el Reino Unido (eu-west-2), la Unión Europea (eu-central-1), Estados Unidos (us-east-1) y Asia-Pacífico (ap-southeast-1). Para entidades financieras, del sector salud o de defensa sujetas a estrictas normativas de cumplimiento, CostGlass también ofrece el modelo Enterprise Bring-Your-Own-Cloud (BYOC), ejecutando todo el motor analítico serverless de forma privada dentro de su propia cuenta de AWS y VPC, garantizando que ninguna telemetría financiera salga del perímetro de su nube.
¿Preparado para proteger los márgenes brutos de su SaaS y obtener total claridad en los costes unitarios de AWS, Azure, GCP, Kubernetes e IA ante su consejo directivo? Explore los precios transparentes de CostGlass, consulte nuestro manual comparativo frente a competidores de FinOps o descubra cómo conectar su entorno multi-cloud en cuestión de minutos con nuestra guía de configuración de Unit Economics.
Multi-Cloud Unit Economics ist die finanzielle Disziplin, gemeinsam genutzte Cloud-Infrastruktur, Kubernetes-Container-Compute und Ausgaben für KI-Inferenz direkt diskreten Geschäftsmetriken wie den Kosten pro Kunde, den Kosten pro API-Transaktion oder den Kosten pro Mandant (Tenant) zuzuordnen. Durch die direkte Zuordnung des dynamischen Cloud-Verbrauchs zu den Herstellungskosten (Cost of Goods Sold, COGS) isolieren Engineering- und Finanzverantwortliche unrentable Kundensegmente, sichern SaaS-Bruttomargen von über 75 % und schließen unbemerkte Umsatzlecks.
Die Krise im Vorstand: Warum Cloud-Ausgaben von OpEx zur Bruttomargen-Rechnung wechseln müssen
Bei Enterprise-SaaS-Unternehmen wurde die Cloud-Infrastruktur in den Bilanzen historisch häufig pauschal als undifferenzierter operativer Betriebsaufwand (OpEx) verbucht. Während diese buchhalterische Abkürzung in makroökonomischen Zyklen mit Fokus auf Wachstum um jeden Preis ausreichte, führt sie bei modernen Führungsteams zu gravierenden blinden Flecken.
Wenn Cloud-Compute, Managed Databases und mandantenfähige KI-Pipelines parallel zum jährlich wiederkehrenden Umsatz (ARR) skalieren, steigen die aggregierten Cloud-Kosten naturgemäß an. Ohne eine granulare Zuordnung können Chief Financial Officers (CFOs) und Chief Technology Officers (CTOs) jedoch elementare Fragen von Investoren nicht fundiert beantworten:
- Welche Enterprise-Verträge weisen aufgrund individueller Compute- oder Datenaufbewahrungsanforderungen eine negative Bruttomarge auf?
- Wie hoch sind die infrastrukturellen Basiskosten für das Onboarding der nächsten 1.000 aktiven Mandanten?
- Um wie viel haben kürzliche LLM-Feature-Rollouts (OpenAI, Anthropic oder selbst gehostete vLLM-Cluster auf AWS EKS) unsere Grenzkosten pro Kundeninteraktion erhöht?
- Welcher Anteil der Cloud-Ausgaben stellt echte Herstellungskosten (COGS für die Bereitstellung der Produktionsumgebung) dar und was entfällt auf F&E (R&D) oder internen Engineering-Overhead?
Die unzureichende Trennung von Produktions-COGS und Non-Production-Engineering-Ausgaben drückt die ausgewiesenen Bruttomargen künstlich nach unten, was die Bewertungsmultiplikatoren von Softwareunternehmen bei Audits und Finanzierungsrunden direkt schmälert.
Die architektonische Herausforderung: Das Problem geteilter Infrastrukturen
Die Zuordnung dedizierter Single-Tenant-Infrastrukturen (wie ein isolierter AWS-Account oder eine dedizierte Azure-Subscription pro Kunde) ist trivial. Moderne SaaS-Architekturen basieren jedoch auf hochgradig gemeinsam genutzten Multi-Tenant-Ebenen, die für maximale Elastizität und Ressourcenauslastung konzipiert sind:
- Mandantenfähige Kubernetes-Cluster: Pods von fünfzig Microservices laufen auf gemeinsamen EKS-, GKE- oder AKS-Node-Pools, auf denen CPU- und Speicherlast sekundengenau schwanken.
- Gemeinsam genutzte Cloud-Datenbanken & Data Warehouses: Multi-Tenant-Cluster von Amazon Aurora, Snowflake-Data-Sharing und DynamoDB-Tabellen verarbeiten gemischte Lese- und Schreibvorgänge ohne isolierte Infrastrukturgrenzen.
- Gemeinsame Ingress- & Netzwerkressourcen: Zentralisierte NAT Gateways, Transit Gateways und Cloudflare-Enterprise-Pipelines leiten Terabytes an kunden- und dienstübergreifendem Traffic weiter – ganz ohne native Mandanten-Tags.
- KI-Token-Ingestion-Pipelines: Zentralisierte Inferenz-Proxys rufen Foundation-Modelle von OpenAI und Anthropic auf, wodurch mandantenspezifische Metadaten auf der Rohrechnung des Anbieters verloren gehen.
Versuchen Unternehmen, dies intern zu lösen, greifen sie meist auf fehleranfällige Tabellenkalkulationen zurück oder bauen eigene Daten-Pipelines auf, die sofort versagen, sobald sich Cloud-Ressourcenbezeichner oder Mandanten-IDs ändern.
Die strategische Mathematik: Wie traditionelle FinOps-Modelle Unit Economics benachteiligen
Um Transparenz über die Stückkosten zu erlangen, evaluieren viele Engineering-Organisationen traditionelle FinOps-Plattformen wie CloudZero, Finout, Vantage oder Cloudability. Die kommerziellen Modelle dieser Legacy-Plattformen untergraben jedoch direkt die SaaS-Stückkostenökonomie.
Plattformen, die einen prozentualen Anteil der Cloud-Ausgaben (typischerweise 1 % bis 3 %) oder einen prozentualen Anteil der Einsparungen berechnen, erheben eine willkürliche Abgabe auf Ihr betriebliches Wachstum. Wächst Ihre mandantenfähige Kundenbasis und vergrößert sich Ihre Infrastruktur berechtigterweise, steigt Ihre FinOps-Software-Rechnung automatisch mit – selbst wenn Ihre Effizienzmetriken auf Weltklasse-Niveau liegen.
Darüber hinaus sperren Punktlösungen wie Finout Unit-Economics-Funktionen regelmäßig hinter teuren Enterprise-Add-ons ein (oftmals 250 bis 500 US-Dollar pro Monat allein für die Erfassung von Geschäftsmetriken) und verlangen zusätzliche +25 % Vertragsaufschlag für containerisierte Kubernetes-Zuordnungen. Im Gegensatz dazu bietet CostGlass native Unit-Cost-Telemetrie, Kubernetes-Kostenzuordnung und Multi-Cloud-Normalisierung zu einem einzigen, transparenten monatlichen Festpreis.
| Evaluierungsvektor | Traditionelle SaaS-Tools (z. B. CloudZero, Finout, Vantage) | Architektonischer Ansatz von CostGlass |
|---|---|---|
| Kommerzielles Modell | 1 %–3 % Gebühr auf Cloud-Ausgaben oder Einsparungen; jährliche, vertriebsgebundene Verträge | Vorhersehbarer monatlicher Festpreis (0 $ Free, 99 $ Starter, 499 $ Growth, 1.499 $ Scale); jederzeit kündbar |
| Zusatzgebühren für Unit Economics | Hinter Premium-Tiers gesperrt oder als Add-on für +250–500 $/Monat bepreist | Nativ ohne Zusatzkosten enthalten in den Tarifen Growth, Scale und Enterprise |
| Kubernetes-Zuordnung | Erfordert separate Lizenzierung (+25 % Gebühr bei Finout) oder Single-Cloud-Agenten | CNCF OpenCost Pod-/Namespace-/GPU-Telemetrie direkt in das einheitliche Ledger integriert |
| Datennormalisierung | Proprietäre Schemas mit 24–48 Stunden Latenzzeit bei Rechnungsdaten | Standardisiertes Multi-Cloud-Schema, das alle 6 Stunden automatisch aktualisiert wird |
| Datenresidenz & BYOC | Multi-Tenant-Hosting rein in den USA; Cloud-Telemetriedaten verlassen Kundenumgebung | Souveräne regionale Zellen in UK, EU, USA, APAC oder 100 % privates In-Account AWS (BYOC) |
| Umsetzung von Optimierungen | Passive Dashboards; generiert Jira-Tickets, die monatelang unbearbeitet bleiben | 8+ dedizierte Senior-DevOps/FinOps-Ingenieurstunden/Monat im Scale-Tarif zur aktiven Umsetzung |
Die Inhouse-Falle: Warum der Eigenbau einer Multi-Cloud-Kostenpipeline scheitert
Angesichts steigender Cloud-Rechnungen und des Drucks auf Vorstandsebene, die SaaS-Bruttomargen zu verteidigen, ziehen Engineering-Teams häufig in Erwägung, interne Multi-Cloud-Kostenpipelines und eigene SQL-Datenmodelle selbst zu entwickeln. Auf dem Papier klingt das Vorhaben überschaubar: ETL-Skripte schreiben, um AWS CUR 2.0, Azure MCA, Google Cloud BigQuery-Exporte, Kubernetes-Pod-Metriken und OpenAI-API-Logs in ein internes Data Warehouse zu laden.
In der Praxis erweist sich der Eigenbau einer internen FinOps-Pipeline jedoch als extrem teure Entwicklungsfalle:
- Permanente Schema- und API-Änderungen: Cloud-Anbieter passen Abrechnungsformate, Rabattzeilen und Rabattstrukturen kontinuierlich an. Eine Pipeline, die heute fehlerfrei läuft, scheitert nächsten Monat und erfordert ständige manuelle Eingriffe.
- Verlust an Entwicklungsgeschwindigkeit: Die Pflege von Schnittstellen, Transformationsskripten und internen Dashboards bindet wertvolle Senior-Ingenieure, die eigentlich am Kernprodukt arbeiten sollten. Unternehmen verbrennen schnell über 150.000 $ an jährlichen Ingenieursgehältern, nur um interne Übersichten instandzuhalten, die der Realität 48 Stunden hinterherhinken.
- Der tote Winkel geteilter Infrastruktur: Das Verfassen individueller SQL-Abfragen zur Aufteilung geteilter Kubernetes-Cluster, Datenbanken und Gateways auf dynamische Mandanten erfordert permanente Anpassungen. Ohne automatisiertes Virtual Tagging weichen interne Zahlen schnell von den echten Rechnungen ab.
- Fehlende aktive Umsetzung: Selbst wenn ein internes Dashboard die Kosten pro Kunde korrekt ermittelt, bleibt es bei passiven Berichten. Es bietet weder automatisierte Instanz-Zeitpläne noch aktive Größenanpassungen.
Aus diesem Grund entscheiden sich vorausschauende CTOs und CFOs für eine schlüsselfertige Plattform: CostGlass liefert sofort revisionssichere Transparenz, ohne interne Entwicklungsressourcen zu binden.
Konfiguration und Automatisierung von Unit Economics in CostGlass
Statt eigene SQL-Queries kontinuierlich weiterzuentwickeln, zu warten und anzupassen, sobald Cloud-Anbieter ihre Billing-Export-Schemas verändern, automatisiert CostGlass die Stückkostenzuordnung über intuitive Plattform-Workflows.
Schritt 1: Cloud-, Container- und KI-Anbieter anbinden
Folgen Sie den Schritt-für-Schritt-Anleitungen in der CostGlass Verbindungsübersicht, um Ihre Infrastruktur über schreibgeschützte IAM-Rollen und Service Principals nach dem Least-Privilege-Prinzip zu integrieren:
- Multi-Cloud-Billing: Konfigurieren Sie AWS via CloudFormation oder Terraform mit automatisierter CUR 2.0-Ingestion, Microsoft Azure sowie Google Cloud.
- Kubernetes-Pod-Zuordnung: Rollen Sie den leichtgewichtigen CNCF OpenCost Exporter pro Cluster aus, wie in Kubernetes-Kosten beschrieben.
- KI- & Observability-APIs: Fügen Sie schreibgeschützte API-Zugangsdaten für OpenAI, Anthropic und Snowflake unter SaaS- & KI-Ausgaben erfassen hinzu.
Schritt 2: COGS mit Virtual Tagging v2 klassifizieren
Gemeinsam genutzten Datenbanken, nicht zugeordneten Nodes und Altsystemen fehlen oft saubere Tags auf Cloud-Ebene. Anstatt Ihr Plattform-Team dazu zu zwingen, Terraform-Code umzuschreiben und State-Drift in Produktionsumgebungen zu riskieren, navigieren Sie zu Virtual Tagging (#finops:virtual-tags).
- Definieren Sie ein Virtual Tag namens
VTAG:FinancialBucket. - Erstellen Sie eine Regel, die alle Accounts mit dem Tag
env=prodsowie definierte Produktions-EKS-Cluster und OpenAI-OrganisationsschlüsselCOGS_Productionzuweist. - Weisen Sie Test-Accounts, Sandbox-VPCs und Datadog-Staging-Endpunkte
OpEx_Research_And_Developmentzu. - CostGlass kompiliert Ihre Regeln direkt in eine indizierte SQL-Engine und kategorisiert rückwirkend 100 % der ungetaggten historischen Infrastruktur – ohne eine einzige Live-Ressource in der Cloud zu verändern.
Schritt 3: Benutzerdefinierte Geschäftsvolumenmetriken definieren
Navigieren Sie zu Unit Economics (#finops:unit-economics) und verbinden Sie Ihre Geschäftsvolumen-Telemetriedaten:
- Definieren Sie Nenner-Metriken (z. B. monatlich aktive Mandanten, verarbeitete Transaktionen oder 1.000 verarbeitete Modell-Tokens) per API oder über einen monatlichen CSV-Upload.
- Verknüpfen Sie den Nenner mit dem Ausgabenbereich
COGS_Production. - Konfigurieren Sie automatisierte Schwellenwert-Alerts, um Ihr Engineering-Team via Slack oder Microsoft Teams zu benachrichtigen, wenn die Stückkosten eines bestimmten Kundensegments im Wochenvergleich um mehr als 5 % ansteigen.
Schritt 4: Vorstandstaugliche Margenberichte exportieren
Erstellen Sie über die Executive Reports Library (#finops:reports) prüffähige, flächenbereinigte (Like-For-Like) Monatsberichte (Month-To-Date, MTD). Exportieren Sie native Excel- (.xlsx), CSV- und PDF-Vorstandsunterlagen, die Ihre SaaS-Bruttomargenstruktur, die Verteilung der Kosten pro Kunde und die Effizienz Ihrer Produktionsinfrastruktur übersichtlich darstellen.
Der CostGlass-Vorteil: Integrierte Engineering-Umsetzung
Traditionelle FinOps-Tools beenden ihren Workflow meist mit einem Diagramm, das zeigt, dass sich die Kosten pro Kundenanfrage verdoppelt haben. Die Behebung überlassen sie vollständig Ihren Engineering-Teams, was zu Hunderten neuer Jira-Tickets in einem ohnehin überlasteten Backlog führt.
Für wachsende Unternehmen ohne eigenes FinOps-Personal verbindet CostGlass Software-Intelligenz mit echter technischer Umsetzungskompetenz durch erfahrene Ingenieure. Im Rahmen des CostGlass Scale-Tarifs erhalten Kunden jeden Monat 8+ dedizierte Arbeitsstunden erfahrener Senior-DevOps- und FinOps-Ingenieure.
Unsere Ingenieure erstellen nicht nur Empfehlungen – sie setzen diese direkt für Sie um. Ob es um das Rightsizing überdimensionierter EKS-Node-Pools geht, die Konfiguration cloudübergreifender Start/Stopp-Zeitpläne für Instanzen (cg-schedule), die Eliminierung ungenutzter NAT Gateways oder das Erstellen driftfreier Terraform-Pull-Requests: CostGlass erzielt messbare Kosteneinsparungen, während sich Ihre internen Engineering-Teams weiterhin voll auf das Produkt konzentrieren können.
Häufig gestellte Fragen (FAQ)
Wie unterscheidet sich die Unit-Economics-Berechnung zwischen Single-Tenant- und Multi-Tenant-SaaS?
Single-Tenant-SaaS-Umgebungen stellen dedizierte Cloud-Accounts, VPCs oder Subscriptions für jeden Kunden bereit, wodurch die direkte Rechnungszuordnung über Rollups auf Kontoebene sehr einfach ist. Multi-Tenant-SaaS-Umgebungen hingegen betreiben Hunderte von Kunden gleichzeitig auf geteilten Compute-Ressourcen, Datenbank-Clustern und Kubernetes-Node-Pools. In Multi-Tenant-Systemen erfordert Unit Economics die Verknüpfung normalisierter Abrechnungsdaten mit Anwendungs-Telemetriedaten (wie Request-Volumen, Pod-CPU-Zeit oder Anzahl der Datenbankabfragen), um gemeinsame Kosten präzise zuzuordnen.
Kann CostGlass die API-Ausgaben von OpenAI und Anthropic auf Einzelkundenbasis erfassen?
Ja. Durch die Kombination der nativen SaaS/KI-Konnektoren von CostGlass (die Modellnutzung, Prompt-/Completion-Tokens und Batch-API-Rabatte alle 6 Stunden erfassen) mit API-Proxy-Logs oder Virtual Tags auf Anwendungsebene ordnet CostGlass generative KI-Inferenzkosten direkt Ihren Mandanten-Unit-Economics-Berichten zu. Dies verhindert, dass der Verbrauch von LLM-Tokens unbemerkt Ihre Software-Bruttomargen schmälert.
Wie schützt CostGlass souveräne Abrechnungsdaten für regulierte Unternehmen?
CostGlass bietet souveräne regionale Datenresidenzzellen im Vereinigten Königreich (eu-west-2), in der Europäischen Union (eu-central-1), den Vereinigten Staaten (us-east-1) und im asiatisch-pazifischen Raum (ap-southeast-1). Für Finanzdienstleister, das Gesundheitswesen oder Verteidigungsunternehmen mit strengen Compliance-Vorgaben bietet CostGlass zudem ein Enterprise Bring-Your-Own-Cloud (BYOC)-Bereitstellungsmodell. Dabei läuft die gesamte serverlose Analyseplattform vollständig privat in Ihrem eigenen AWS-Account und Ihrer VPC, sodass keinerlei finanzielle Telemetriedaten Ihr Cloud-Perimeter verlassen.
Sind Sie bereit, Ihre SaaS-Bruttomargen zu schützen und vorstandstaugliche Transparenz über Ihre Stückkosten für AWS, Azure, GCP, Kubernetes und KI zu gewinnen? Entdecken Sie die transparente Preisgestaltung von CostGlass, prüfen Sie unser FinOps-Wettbewerbsvergleichs-Playbook oder erfahren Sie in unserem Leitfaden zur Einrichtung von Unit Economics, wie Sie Ihre Multi-Cloud-Umgebung in wenigen Minuten anbinden.
L'unit economics multi-cloud est la discipline financière consistant à cartographier l'infrastructure cloud partagée, le calcul de conteneurs Kubernetes et les dépenses d'inférence d'IA directement vers des métriques métier discrètes telles que le coût par client, le coût par transaction API ou le coût par locataire (tenant). En attribuant la consommation dynamique du cloud directement au coût des biens vendus (COGS - Cost of Goods Sold), les leaders de l'ingénierie et de la finance isolent les segments de clientèle non rentables, défendent des marges brutes SaaS supérieures à 75 % et éliminent les fuites invisibles de revenus.
La crise en salle de conseil : pourquoi les dépenses cloud doivent passer d'OpEx à la comptabilité de marge brute
Pour les entreprises SaaS, l'infrastructure cloud a historiquement été regroupée sous forme de dépense opérationnelle (OpEx) indifférenciée sur les états financiers de l'entreprise. Bien que ce raccourci comptable ait suffi pendant les cycles macroéconomiques de croissance à tout prix, il crée de sérieux angles morts pour les équipes de direction modernes.
Lorsque le calcul cloud, les bases de données gérées et les pipelines d'IA multi-locataires évoluent proportionnellement aux revenus récurrents annuels (ARR), les dépenses cloud globales augmentent naturellement. Cependant, sans attribution granulaire, les directeurs financiers (CFO) et directeurs de la technologie (CTO) ne peuvent pas répondre aux questions fondamentales des investisseurs :
- Quels contrats d'entreprise fonctionnent avec des marges brutes négatives en raison d'exigences de calcul sur mesure ou de rétention de données ?
- Quel est le coût d'infrastructure de base pour intégrer les 1 000 prochains locataires actifs ?
- Dans quelle mesure les récents déploiements de fonctionnalités LLM (OpenAI, Anthropic ou clusters vLLM auto-hébergés sur AWS EKS) ont-ils augmenté notre coût marginal par interaction client ?
- Quelle part des dépenses cloud représente le véritable coût des biens vendus (livraison en production) par rapport à la R&D ou aux frais généraux d'ingénierie interne ?
Ne pas séparer les COGS de production des dépenses d'ingénierie hors production réduit artificiellement les marges brutes déclarées, diminuant directement les multiples de valorisation des entreprises de logiciels lors des audits et des levées de fonds.
Le défi architectural : le problème d'attribution de l'infrastructure partagée
Attribuer une infrastructure dédiée à un seul locataire (comme un compte AWS isolé ou une souscription Azure dédiée par client) est trivial. Les architectures SaaS modernes, cependant, reposent sur des couches hautement mutualisées et multi-locataires conçues pour l'élasticité et l'efficacité d'utilisation des ressources :
- Clusters Kubernetes multi-locataires : Les pods d'une cinquantaine de microservices s'exécutent sur des pools de nœuds EKS, GKE ou AKS partagés où la pression CPU et mémoire fluctue seconde par seconde.
- Bases de données et entrepôts cloud partagés : Les clusters Amazon Aurora multi-locataires, le partage de données Snowflake et les tables DynamoDB traitent des lectures et écritures mixtes sans frontières d'infrastructure isolées.
- Ingress et réseaux partagés : Les passerelles NAT Gateway centralisées, les Transit Gateways et les pipelines d'entreprise Cloudflare acheminent des téraoctets de trafic inter-services et client sans tags natifs de locataires.
- Pipelines d'ingestion de tokens d'IA : Des proxys d'inférence centralisés appellent les modèles de fondation OpenAI et Anthropic, éliminant les métadonnées au niveau de l'utilisateur de la facture brute du fournisseur.
Lorsque les organisations tentent de résoudre ce problème en interne, elles mettent généralement en place des réconciliations fragiles sur tableur ou créent des pipelines de données internes qui échouent dès que les identifiants de ressources cloud ou de locataires dérivent.
Le calcul stratégique : comment les modèles FinOps traditionnels pénalisent l'Unit Economics
Pour obtenir une visibilité sur les coûts unitaires, de nombreuses organisations d'ingénierie évaluent les plateformes FinOps traditionnelles comme CloudZero, Finout, Vantage ou Cloudability. Cependant, les modèles commerciaux des plateformes historiques sapent directement l'unit economics du SaaS.
Les plateformes qui facturent un pourcentage des dépenses cloud (généralement 1 % à 3 %) ou un pourcentage des économies imposent une taxe arbitraire sur le passage à l'échelle opérationnelle. À mesure que votre base de clients multi-locataires s'élargit et que votre infrastructure s'étend légitimement, votre facture d'outils FinOps augmente en tandem—même lorsque vos métriques d'efficacité sous-jacentes restent exceptionnelles.
De plus, des solutions ponctuelles comme Finout restreignent régulièrement l'accès à l'Unit Economics derrière des modules complémentaires d'entreprise onéreux (ajoutant souvent 250 $ à 500 $ par mois uniquement pour l'ingestion de métriques métier), tout en facturant une prime contractuelle supplémentaire de +25 % pour l'allocation conteneurisée Kubernetes. En revanche, CostGlass offre une télémétrie native des coûts unitaires, une allocation Kubernetes et une normalisation multi-cloud pour un tarif mensuel fixe et transparent unique.
| Vecteur d'évaluation | Outils SaaS traditionnels (ex. CloudZero, Finout, Vantage) | Approche architecturale de CostGlass |
|---|---|---|
| Modèle commercial | Taxe de 1 % à 3 % sur les dépenses ou sur les économies ; contrats annuels soumis aux équipes commerciales | Forfait mensuel fixe prévisible (0 $ Free, 99 $ Starter, 499 $ Growth, 1 499 $ Scale) ; résiliable à tout moment |
| Frais d'extension Unit Economics | Réservé aux niveaux premium ou facturé sous forme d'extensions à +250–500 $/mois | Inclus nativement sans coût supplémentaire dans les forfaits Growth, Scale et Enterprise |
| Allocation Kubernetes | Nécessite une licence distincte (+25 % de frais chez Finout) ou des agents mono-cloud | Télémétrie de pod/namespace/GPU CNCF OpenCost intégrée au registre unifié |
| Normalisation des données | Schémas propriétaires avec une latence de facturation de 24 à 48 heures | Schéma multi-cloud standardisé actualisé automatiquement toutes les 6 heures |
| Résidence des données et BYOC | Hébergement multi-tenant exclusivement aux États-Unis ; la télémétrie cloud quitte le périmètre du client | Cellules régionales souveraines au Royaume-Uni, dans l'UE, aux États-Unis et en APAC ou 100 % Private AWS In-Account (BYOC) |
| Exécution de la remédiation | Tableaux de bord passifs ; génère des tickets Jira qui restent non assignés pendant des mois | Plus de 8 heures/mois d'ingénieurs seniors DevOps/FinOps dédiés sur le plan Scale pour exécuter les correctifs |
Le piège du développement interne : pourquoi créer sa propre pipeline multi-cloud échoue
Face à la hausse des factures cloud et à la pression du conseil d'administration pour protéger les marges brutes SaaS, les équipes d'ingénierie envisagent souvent de construire leurs propres pipelines de coûts multi-cloud et leurs modèles SQL internes. Sur le papier, la démarche semble accessible : concevoir des scripts ETL pour intégrer AWS CUR 2.0, Azure MCA, les exports GCP BigQuery, les métriques Kubernetes et les logs OpenAI dans un entrepôt de données.
En pratique, concevoir et maintenir un pipeline FinOps multi-cloud en interne constitue l'un des pièges les plus coûteux pour une organisation technique :
- Dérive permanente des schémas et des API : Les fournisseurs cloud modifient régulièrement leurs formats de facturation, les lignes de remises et les mécanismes d'amortissement. Un pipeline fonctionnel aujourd'hui cesse de fonctionner le mois suivant et exige une maintenance constante.
- Pénalisation de la vélocité produit : Maintenir des scripts d'ingestion et des tableaux de bord internes mobilise des ingénieurs seniors au détriment des fonctionnalités à forte valeur ajoutée. L'entreprise dépense facilement plus de 150 000 $ par an en temps d'ingénierie simplement pour maintenir des graphiques en retard de 48 heures.
- L'angle mort des infrastructures partagées : Rédiger des requêtes SQL sur mesure pour imputer des clusters Kubernetes partagés, des bases de données et des passerelles réseau entre des centaines de clients exige des refontes permanentes. Sans Virtual Tagging automatisé, les chiffres calculés divergent rapidement des factures réelles.
- Absence totale de remédiation : Un outil conçu en interne se limite à afficher des indicateurs passifs. Il ne propose aucun arrêt automatique planifié des instances ni optimisation active des ressources.
C'est pourquoi les CTO et CFO choisissent une solution éprouvée : adopter CostGlass garantit une visibilité immédiate et prête pour les audits, sans surcharger les équipes d'ingénierie.
Comment configurer et automatiser l'Unit Economics dans CostGlass
Plutôt que de concevoir, maintenir et mettre à jour des requêtes SQL personnalisées au fur et à mesure que les fournisseurs cloud modifient leurs schémas d'exportation de facturation, CostGlass automatise l'allocation des coûts unitaires via des flux de travail intuitifs sur la plateforme.
Étape 1 : Connectez vos fournisseurs Cloud, Conteneurs et IA
Suivez les guides pas à pas dans l'Aperçu des connexions CostGlass pour intégrer votre infrastructure via des rôles IAM et des principaux de service en lecture seule et selon le principe du moindre privilège :
- Facturation multi-cloud : Configurez AWS via CloudFormation ou Terraform avec une ingestion automatisée CUR 2.0, Microsoft Azure, et Google Cloud.
- Allocation des pods Kubernetes : Déployez l'exportateur léger CNCF OpenCost par cluster comme détaillé dans Coûts Kubernetes.
- API d'IA et d'observabilité : Ajoutez des identifiants d'API en lecture seule pour OpenAI, Anthropic et Snowflake sous Suivi des dépenses SaaS et IA.
Étape 2 : Classifier les COGS avec le Tagging Virtuel v2
Les bases de données partagées, les nœuds non alloués et les ressources héritées manquent souvent de tags nets au niveau du cloud. Au lieu de contraindre votre équipe de plateforme à refactoriser Terraform et à déclencher des dérives d'état (state drift) sur vos environnements de production, accédez à Tagging Virtuel (#finops:virtual-tags).
- Définissez un tag virtuel nommé
VTAG:FinancialBucket. - Créez une règle associant tous les comptes tagués
env=prod, ainsi que les clusters EKS de production désignés et les clés d'organisation OpenAI, àCOGS_Production. - Associez les comptes de test, les VPC de bac à sable (sandbox) et les points de terminaison de staging Datadog à
OpEx_Research_And_Development. - CostGlass compile vos règles directement dans un moteur SQL indexé, catégorisant rétroactivement 100 % de l'infrastructure historique non taguée sans modifier la moindre ressource cloud en production.
Étape 3 : Définir des métriques de volume d'activité personnalisées
Accédez à Unit Economics (#finops:unit-economics) et connectez votre télémétrie de volume d'activité :
- Définissez des métriques de dénominateur unitaire (par exemple, Locataires actifs mensuels, Transactions traitées ou 1k Tokens de modèle ingérés) via l'API ou par import CSV mensuel manuel.
- Liez le dénominateur à votre périmètre de dépenses
COGS_Production. - Configurez des alertes de seuil automatisées pour avertir votre canal d'ingénierie sur Slack ou Microsoft Teams chaque fois que le coût unitaire d'un segment client spécifique dérive à la hausse de plus de 5 % d'une semaine sur l'autre.
Étape 4 : Exporter des rapports de marges prêts pour le conseil d'administration
Depuis la Bibliothèque de rapports exécutifs (#finops:reports), générez des résumés financiers mensuels à ce jour (MTD) prêts pour l'audit et à périmètre constant (like-for-like). Exportez des dossiers complets au format Excel (.xlsx), CSV et PDF pour le conseil d'administration, détaillant la répartition de votre marge brute SaaS, la distribution des coûts par client et l'efficacité de votre infrastructure de production.
L'avantage CostGlass : l'exécution d'ingénierie intégrée
Les outils FinOps traditionnels concluent leur flux de travail en affichant un graphique indiquant que le coût client par requête a doublé. Ils laissent l'entière charge de la remédiation à vos équipes d'ingénierie, ajoutant des centaines de tickets Jira à un backlog déjà saturé.
Pour les organisations en croissance qui ne disposent pas de personnel FinOps dédié, CostGlass associe l'intelligence logicielle à de réelles compétences d'ingénierie humaine. Dans le cadre du Plan CostGlass Scale, les clients bénéficient de plus de 8 heures d'ingénieurs seniors DevOps et FinOps dédiés chaque mois.
Nos ingénieurs ne se contentent pas de formuler des recommandations : ils les exécutent pour vous. Qu'il s'agisse de redimensionner des pools de nœuds EKS surprovisionnés, de configurer des plannings de démarrage/arrêt d'instances multi-cloud (cg-schedule), d'éliminer les passerelles NAT inactives ou de structurer des pull requests Terraform sans dérive, CostGlass apporte des économies concrètes et mesurables tout en permettant à vos équipes d'ingénierie internes de rester concentrées sur la livraison du produit.
Foire Aux Questions
En quoi l'Unit Economics diffère-t-il entre un SaaS mono-locataire et multi-locataires ?
Les environnements SaaS mono-locataires déploient des comptes cloud, des VPC ou des souscriptions dédiés pour chaque client, rendant l'attribution directe de la facturation simple grâce aux consolidations au niveau du compte. Les environnements SaaS multi-locataires font tourner des centaines de clients simultanément sur des ressources de calcul, des clusters de bases de données et des pools de nœuds Kubernetes partagés. Dans les systèmes multi-locataires, l'unit economics nécessite de combiner des enregistrements de facturation normalisés avec la télémétrie applicative (comme le volume de requêtes, le temps CPU des pods ou le nombre de requêtes en base de données) pour attribuer avec précision les coûts partagés.
CostGlass peut-il suivre les dépenses de l'API OpenAI et Anthropic par client ?
Oui. En combinant les connecteurs SaaS/IA natifs de CostGlass (qui ingèrent l'utilisation au niveau du modèle, les tokens de prompt/complétion et les remises de l'API Batch toutes les 6 heures) avec les logs de proxy d'API au niveau applicatif ou les tags virtuels, CostGlass attribue les coûts d'inférence de l'IA générative directement dans vos rapports d'unit economics par locataire. Cela évite que l'utilisation des tokens LLM n'érode silencieusement vos marges brutes de logiciels.
Comment CostGlass protège-t-il les données de facturation souveraines pour les entreprises réglementées ?
CostGlass propose des cellules régionales de résidence des données souveraines situées au Royaume-Uni (eu-west-2), dans l'Union européenne (eu-central-1), aux États-Unis (us-east-1) et en Asie-Pacifique (ap-southeast-1). Pour les services financiers, la santé ou les organisations de défense soumises à des exigences strictes de conformité, CostGlass propose également un modèle de déploiement Enterprise Bring-Your-Own-Cloud (BYOC), exécutant l'intégralité du moteur d'analyse serverless de manière privée au sein de votre propre compte AWS et VPC, garantissant qu'aucune télémétrie financière ne quitte le périmètre de votre cloud.
Prêt à protéger vos marges brutes SaaS et à obtenir une visibilité sur les coûts unitaires pour votre conseil d'administration sur AWS, Azure, GCP, Kubernetes et l'IA ? Découvrez la Tarification transparente de CostGlass, consultez notre Guide comparatif des concurrents FinOps, ou apprenez à connecter votre environnement multi-cloud en quelques minutes grâce à notre Guide de configuration d'Unit Economics.
Ready to unify your multi-cloud costs?
See your AWS, Azure, GCP, and Kubernetes spend in canonical FOCUS 1.0 in under 15 minutes.