SaaS & AI Spend
Spend and token analytics for OpenAI, Anthropic, DeepSeek, Datadog, Snowflake and cloud AI services.
SaaS & AI Spend
See what you spend on AI models and SaaS tools (OpenAI, Anthropic, DeepSeek, Datadog, Snowflake and AI running inside your clouds), how many tokens that buys, and which customers, teams or features cause it.
- One page for the bills that do not come from a cloud console: AI model APIs and SaaS tools, plus AI services your clouds run (Amazon Bedrock, Azure OpenAI, Google Vertex AI).
- Cost comes from each vendor's own cost API. Token counts, caching and request counts come from OpenAI and Anthropic usage APIs only.
- One Date Range control at the top drives every chart and card on the page.
- Label your OpenAI projects and Anthropic workspaces as customers, teams, features or products to see cost per label.
- If a number cannot be measured, the page says so and shows a dash. It never fills a gap with an estimate.
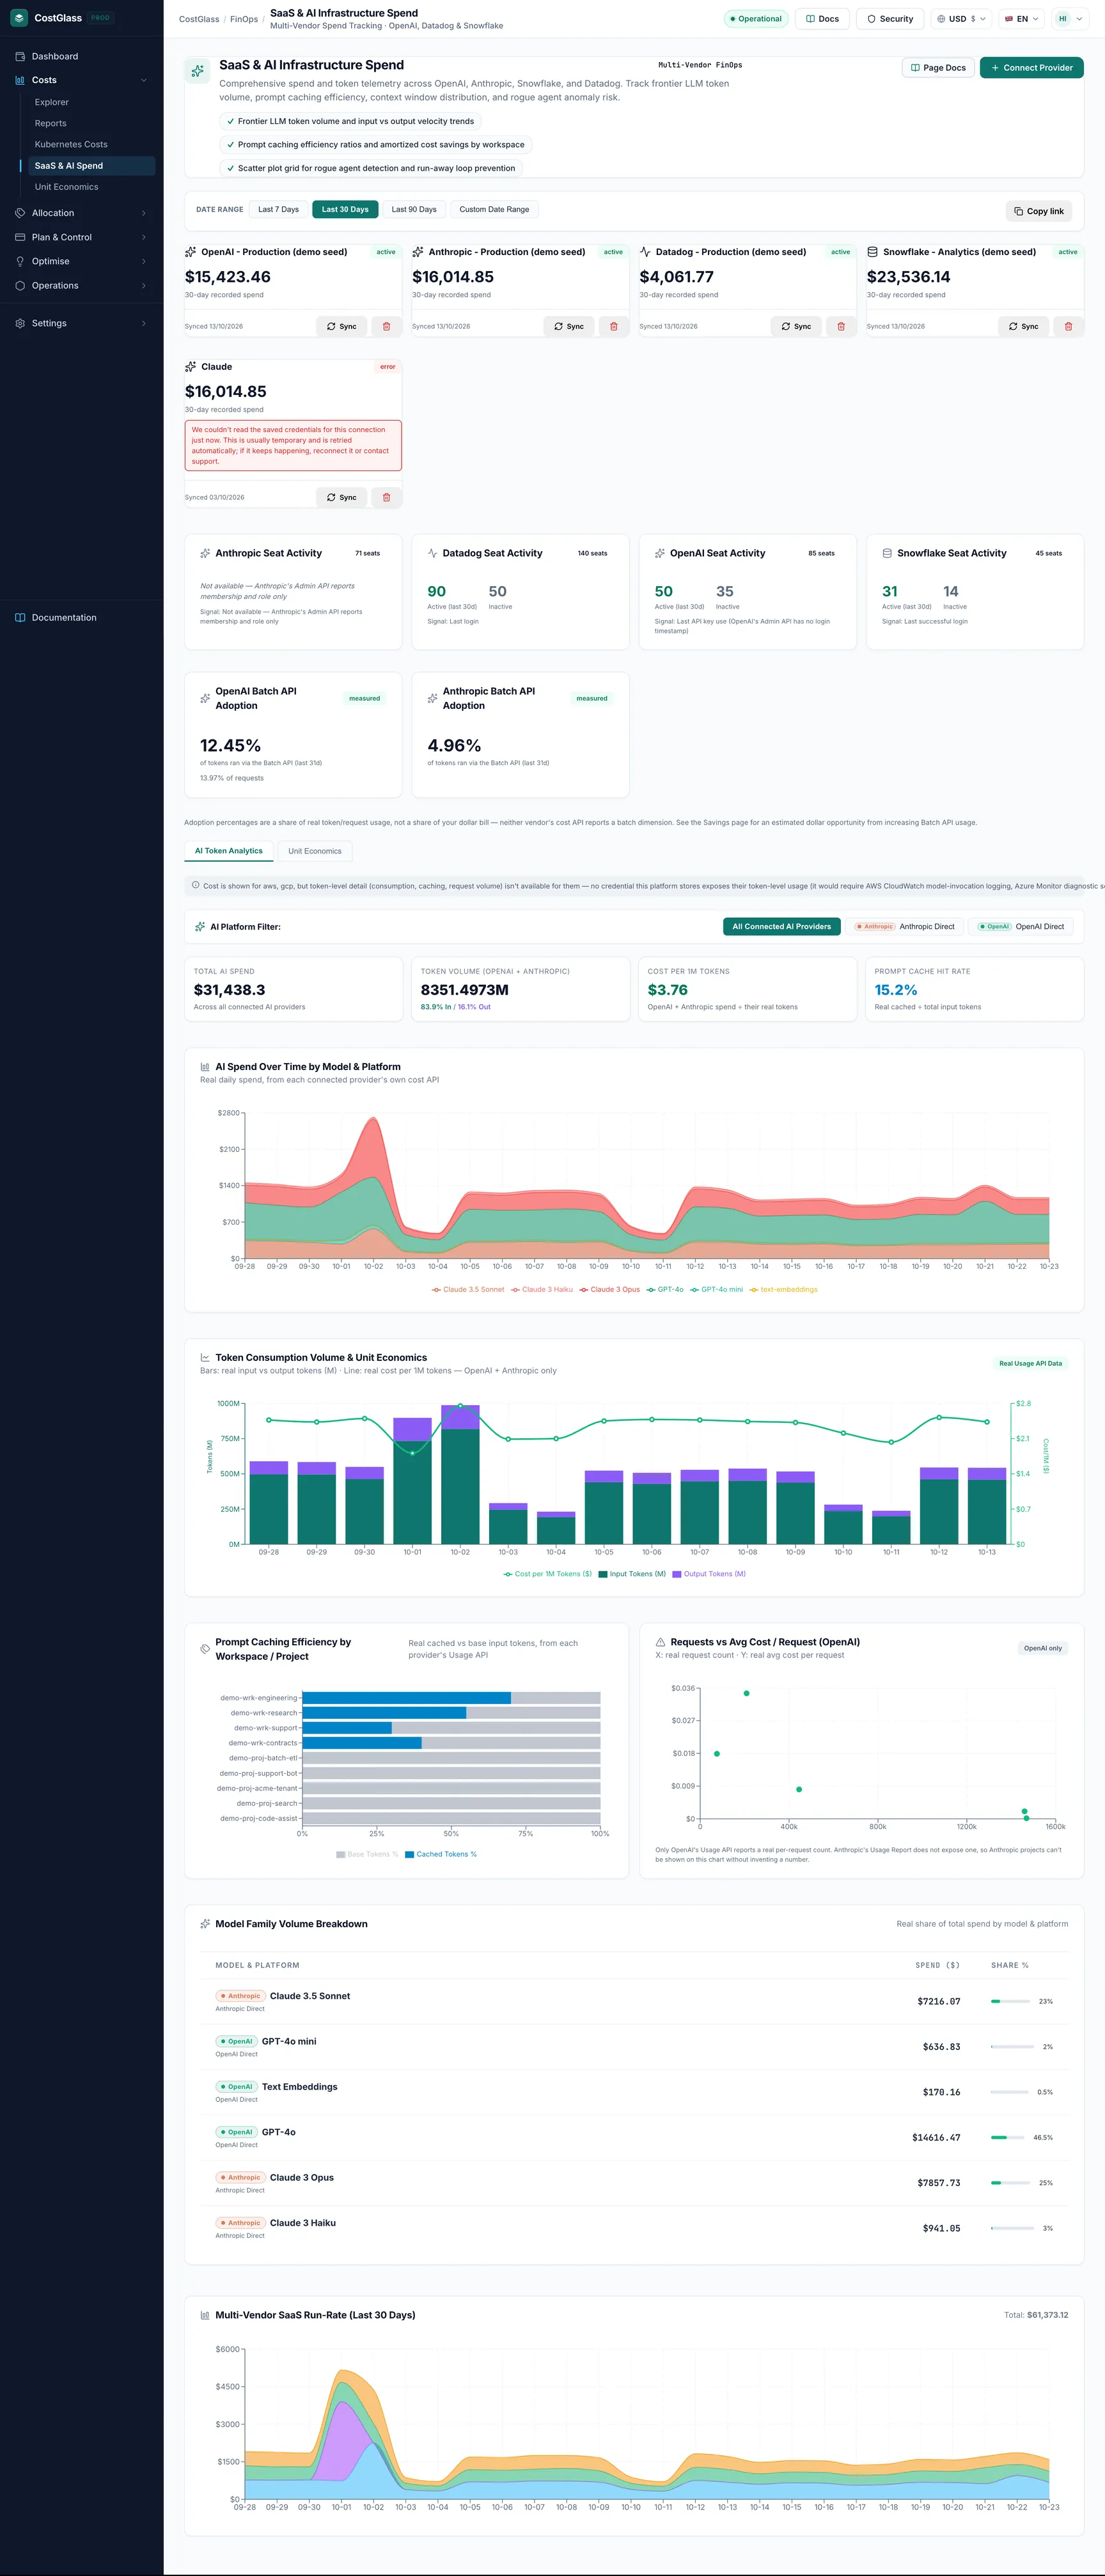
What this page is for
AI and SaaS bills grow fast and arrive from many places. A single prompt change can double an AI bill; a log pipeline can quietly triple an observability bill. This page puts them next to each other so you can answer:
- How much did we spend on each vendor over a period?
- Which models cost the most, and how many tokens did we buy per dollar?
- Are we using cheaper options we are entitled to, such as caching and the Batch API?
- Who or what causes the spend: which customer, team, feature or product?
- Which seats on these tools are actually used?
Before you begin
- At least one vendor connected. The connection steps are in Connect SaaS & AI vendors. Press Connect Provider on this page to start.
- For token detail you need OpenAI or Anthropic connected with an Admin key.
- For AI spend inside your clouds (Bedrock, Azure OpenAI, Vertex AI) you need those clouds connected. Cost appears automatically; token detail does not.
- Data refreshes about every 6 hours, and when you press Sync on a connector card or connect a vendor.
The page from top to bottom
| Area | What it shows |
|---|---|
| Header | Title SaaS & AI Infrastructure Spend and the Connect Provider button. |
| Date Range | One control for the whole page. |
| Connector cards | One card per connected vendor. |
| Seat activity and Batch API adoption | Small cards, shown only when the vendor supports them. |
| AI Token Analytics / Unit Economics | Two tabs about AI usage. |
| Multi-Vendor SaaS Run-Rate | Daily spend per vendor, stacked. |
Date Range and Copy link
Choose Last 7 Days, Last 30 Days, Last 90 Days or Custom Date Range. A custom range shows From and To date boxes (prefilled with the last 30 days); the start must be on or before the end, neither can be in the future, and until both are valid the page does not reload. Every chart, tile and table below follows this range, including the unit economics tab and the Batch API card.
Copy link copies a link to this exact view (range and active tab) for anyone in your organisation. The address bar also updates as you change the view.
Connector cards
Each connected vendor has a card:
| Item | Meaning |
|---|---|
| Name and icon | The connector name you chose when connecting. |
| Status pill | active (green) is working; pending (amber) is waiting for you to finish setup, for example Snowflake step 2; anything else (red) is an error. |
| Big number | The 30-day recorded spend for this vendor. This is a fixed 30-day figure, separate from the Date Range above. |
| Red message | The last error the vendor returned, in its own words, for example a key without permission. |
| Synced date | When the last sync ran, or "Never synced". |
| Sync | Runs a sync now for that vendor. |
| Bin icon | Disconnects the vendor after you confirm. Spend already collected stays in your history. |
What each vendor gives you
The detail you can see depends on what each vendor's own API reports. This is a limit of the vendors, not of CostGlass.
| Source | Cost | Tokens, requests, caching | Good to know |
|---|---|---|---|
| OpenAI | Daily, split by line item and project, from the Admin Costs API. | Yes: input, cached input, output tokens, requests and whether a request used the Batch API. | Needs an Admin key (a normal project key is rejected). The only source of per-request counts. |
| Anthropic | Daily, split by model and token type (for example input, output and cache types) and by workspace, from the Admin Cost Report API. | Yes: input, cached input, output tokens and service tier (Batch or not). No request counts. | Needs an Admin key. The vendor reports cost in cents; CostGlass converts it to dollars. Personal Claude plans cannot be connected. |
| DeepSeek | Daily, from the DeepSeek API (the last 35 days are re-read on each sync). | Cost only. | No seat or token detail. |
| Datadog | Monthly only: one figure per product per calendar month, current and previous month. | Not applicable. | Datadog's cost estimate can lag by up to 72 hours, so the newest days are incomplete. It shows as one point per month on the run-rate chart, not a daily line. Needs both an API key and an Application key, and the right Datadog site. |
| Snowflake | Daily, in real currency, from the organisation usage view (USAGE_IN_CURRENCY_DAILY). | Not applicable. | Needs access granted by a Snowflake organisation administrator (ORGADMIN). If it is missing, the card shows an actionable message instead of a number. The amount is in your Snowflake billing currency and is converted for display; an unsupported currency is reported as such rather than mislabelled. |
| Amazon Bedrock, Azure OpenAI, Google Vertex AI | Taken from your cloud bill. CostGlass recognises AI lines by service name (for example bedrock, openai, cognitive, vertex, generative, gemini, deepseek). | No. CostGlass does not read model invocation logs, so there are no tokens, caching or requests for these. | A note on the page says which connected clouds are cost-only. |
Seat activity
A small card per vendor whose seats CostGlass can list. It shows the number of seats and, where the vendor reports it, how many were Active in the last 30 days and how many were Inactive. Use it to find licences nobody uses.
| Vendor | Activity signal used |
|---|---|
| OpenAI | Last API key use. OpenAI has no login time, so this is an indirect signal. |
| Datadog | Last login. |
| Snowflake | Last successful login. |
| Anthropic | Not available. Anthropic reports membership and role only, so you see the seat count and an explanation instead of active and inactive numbers. |
The card says which signal it uses. CostGlass never compares seats to an invented licence total.
Batch API adoption
A card for OpenAI and for Anthropic showing the percentage of tokens that ran through the Batch APIin the selected range (and, for OpenAI, the percentage of requests). It carries a measured tag.
Why it matters: the Batch API is cheaper (we use 50% off in the savings engine) for work that can wait, such as overnight processing. A low percentage with a lot of non-urgent volume is an opportunity.
AI Token Analytics tab
The first tab. If nothing is connected it says No AI / LLM spend connected yet. Notes at the top (blue pills) explain gaps, for example which connected clouds have cost but no token detail.
AI Platform Filter
Appears when there is more than one source. Buttons such as All Connected AI Providers, AWS Bedrock, Azure OpenAI, GCP Vertex AI, Anthropic Direct, OpenAI Direct and DeepSeek Direct filter the spend chart and the model table.
The four figures
| Tile | How it is calculated | How to use it |
|---|---|---|
| Total AI Spend | All AI cost in the range across every connected source. | Your headline AI bill. |
| Token Volume (OpenAI + Anthropic) | Input plus output tokens in millions, with the % that were input and % output. | A high input share is usual for long prompts; a high output share means long answers, which usually cost more per token. |
| Cost per 1M Tokens | OpenAI plus Anthropic spend divided by their measured tokens. | The best single measure of efficiency. It is deliberately not mixed with Bedrock, Azure or Vertex spend, whose tokens are not measured. |
| Prompt Cache Hit Rate | Cached input tokens divided by all input tokens. | Cached tokens are billed at a lower rate. A low rate on long repeated prompts means money left on the table. |
Without OpenAI or Anthropic usage data, these three token tiles are replaced by Token-Level Detail: "Not available yet", with what to connect.
The charts
- AI Spend Over Time by Model & Platform
- A stacked area chart of real daily spend, one colour per model and platform. Hover for each model's value. Use it to see which model started or stopped costing money, for example after a model upgrade.
- Token Consumption Volume & Unit Economics
- Bars show daily input and output tokens in millions; the green line shows cost per 1M tokens on the right axis. Bars up and line flat means growth at stable efficiency. Line up means you are paying more per token, often a move to a costlier model or less caching. A day with no cost has no line point.
- Prompt Caching Efficiency by Workspace / Project
- For each OpenAI project and Anthropic workspace, the share of input tokens that were cached (blue) against base (grey). Workspaces at the bottom of the list with big token volume are the ones to fix first.
- Requests vs Avg Cost / Request (OpenAI)
- Each dot is an OpenAI project: requests on the horizontal axis, average cost per request on the vertical. A dot far above the others is expensive per call: look for long prompts or a pricey model. A dot far to the right with a high cost is a heavy and costly workload, the first place to look for a runaway loop. Anthropic does not report request counts, so it is not on this chart.
- Model Family Volume Breakdown
- A table of Model & Platform, Spend ($) and Share % bars. Use it to see how concentrated your spend is in one model.
Unit Economics tab (cost per customer, team, feature)
The second tab groups AI spend by a label you assign to each OpenAI project, Anthropic workspace, or the sub-account of another AI source. It answers "what does this customer or feature cost us in AI?". This is separate from the business-metric page, Unit Economics.
- Spend with no label is shown as Unassigned. It is never dropped or guessed from a name. The labels plus Unassigned always add up to the Total AI Spend for the same range.
- $ / Request is only shown for labels backed by real OpenAI request counts. For Anthropic-only or cost-only labels it is a dash.
- A trend chart shows daily spend for the top labels.
Multi-Vendor SaaS Run-Rate
A stacked area chart of daily spend for Snowflake, Datadog, OpenAI and Anthropic, with the range total in the corner. Its heading says "Last 30 Days" but it follows the Date Range you picked. It uses cost in your display currency. Remember that Datadog is monthly, so it appears as one value on the first of each month, not a smooth line. DeepSeek and the cloud AI services are visible in the AI tab and in Reports rather than on this chart.
How to act on what you see
| You see | Try this | Where |
|---|---|---|
| Cost per 1M tokens rising | Check whether a workload moved to a larger model. Route simple tasks (classification, extraction, short answers) to a smaller, cheaper model. | Model tiering |
| Low Batch API adoption and lots of non-urgent work | Move overnight or bulk jobs to the Batch API, which is cheaper. | Savings |
| Low prompt cache hit rate on long, repeated prompts | Restructure prompts so the large stable part comes first and can be cached. CostGlass lists a prompt caching opportunity for Anthropic. | Savings |
| One workspace with high cost per request | Look at prompt length, retries and model choice for that workspace. | Scatter chart |
| Inactive seats | Remove or reassign licences that nobody uses. | Seat activity |
| Datadog or Snowflake growing | Review log ingestion, custom metrics and Snowflake cloud-services overage. | Savings |
| Spend you cannot explain | Label the project or workspace, then set a budget or alert. | Budgets, Anomaly detection |