Dashboard & Platform Screenshot Tour
Visual walkthrough of the CostGlass interface with screenshots covering multi-cloud spend, Cost Explorer, anomalies, Kubernetes allocation, and savings.
Dashboard tour: what you will see
A picture of every page, with what it is for and what to expect on it, so you know where to look before you open it.
Costs & analysis
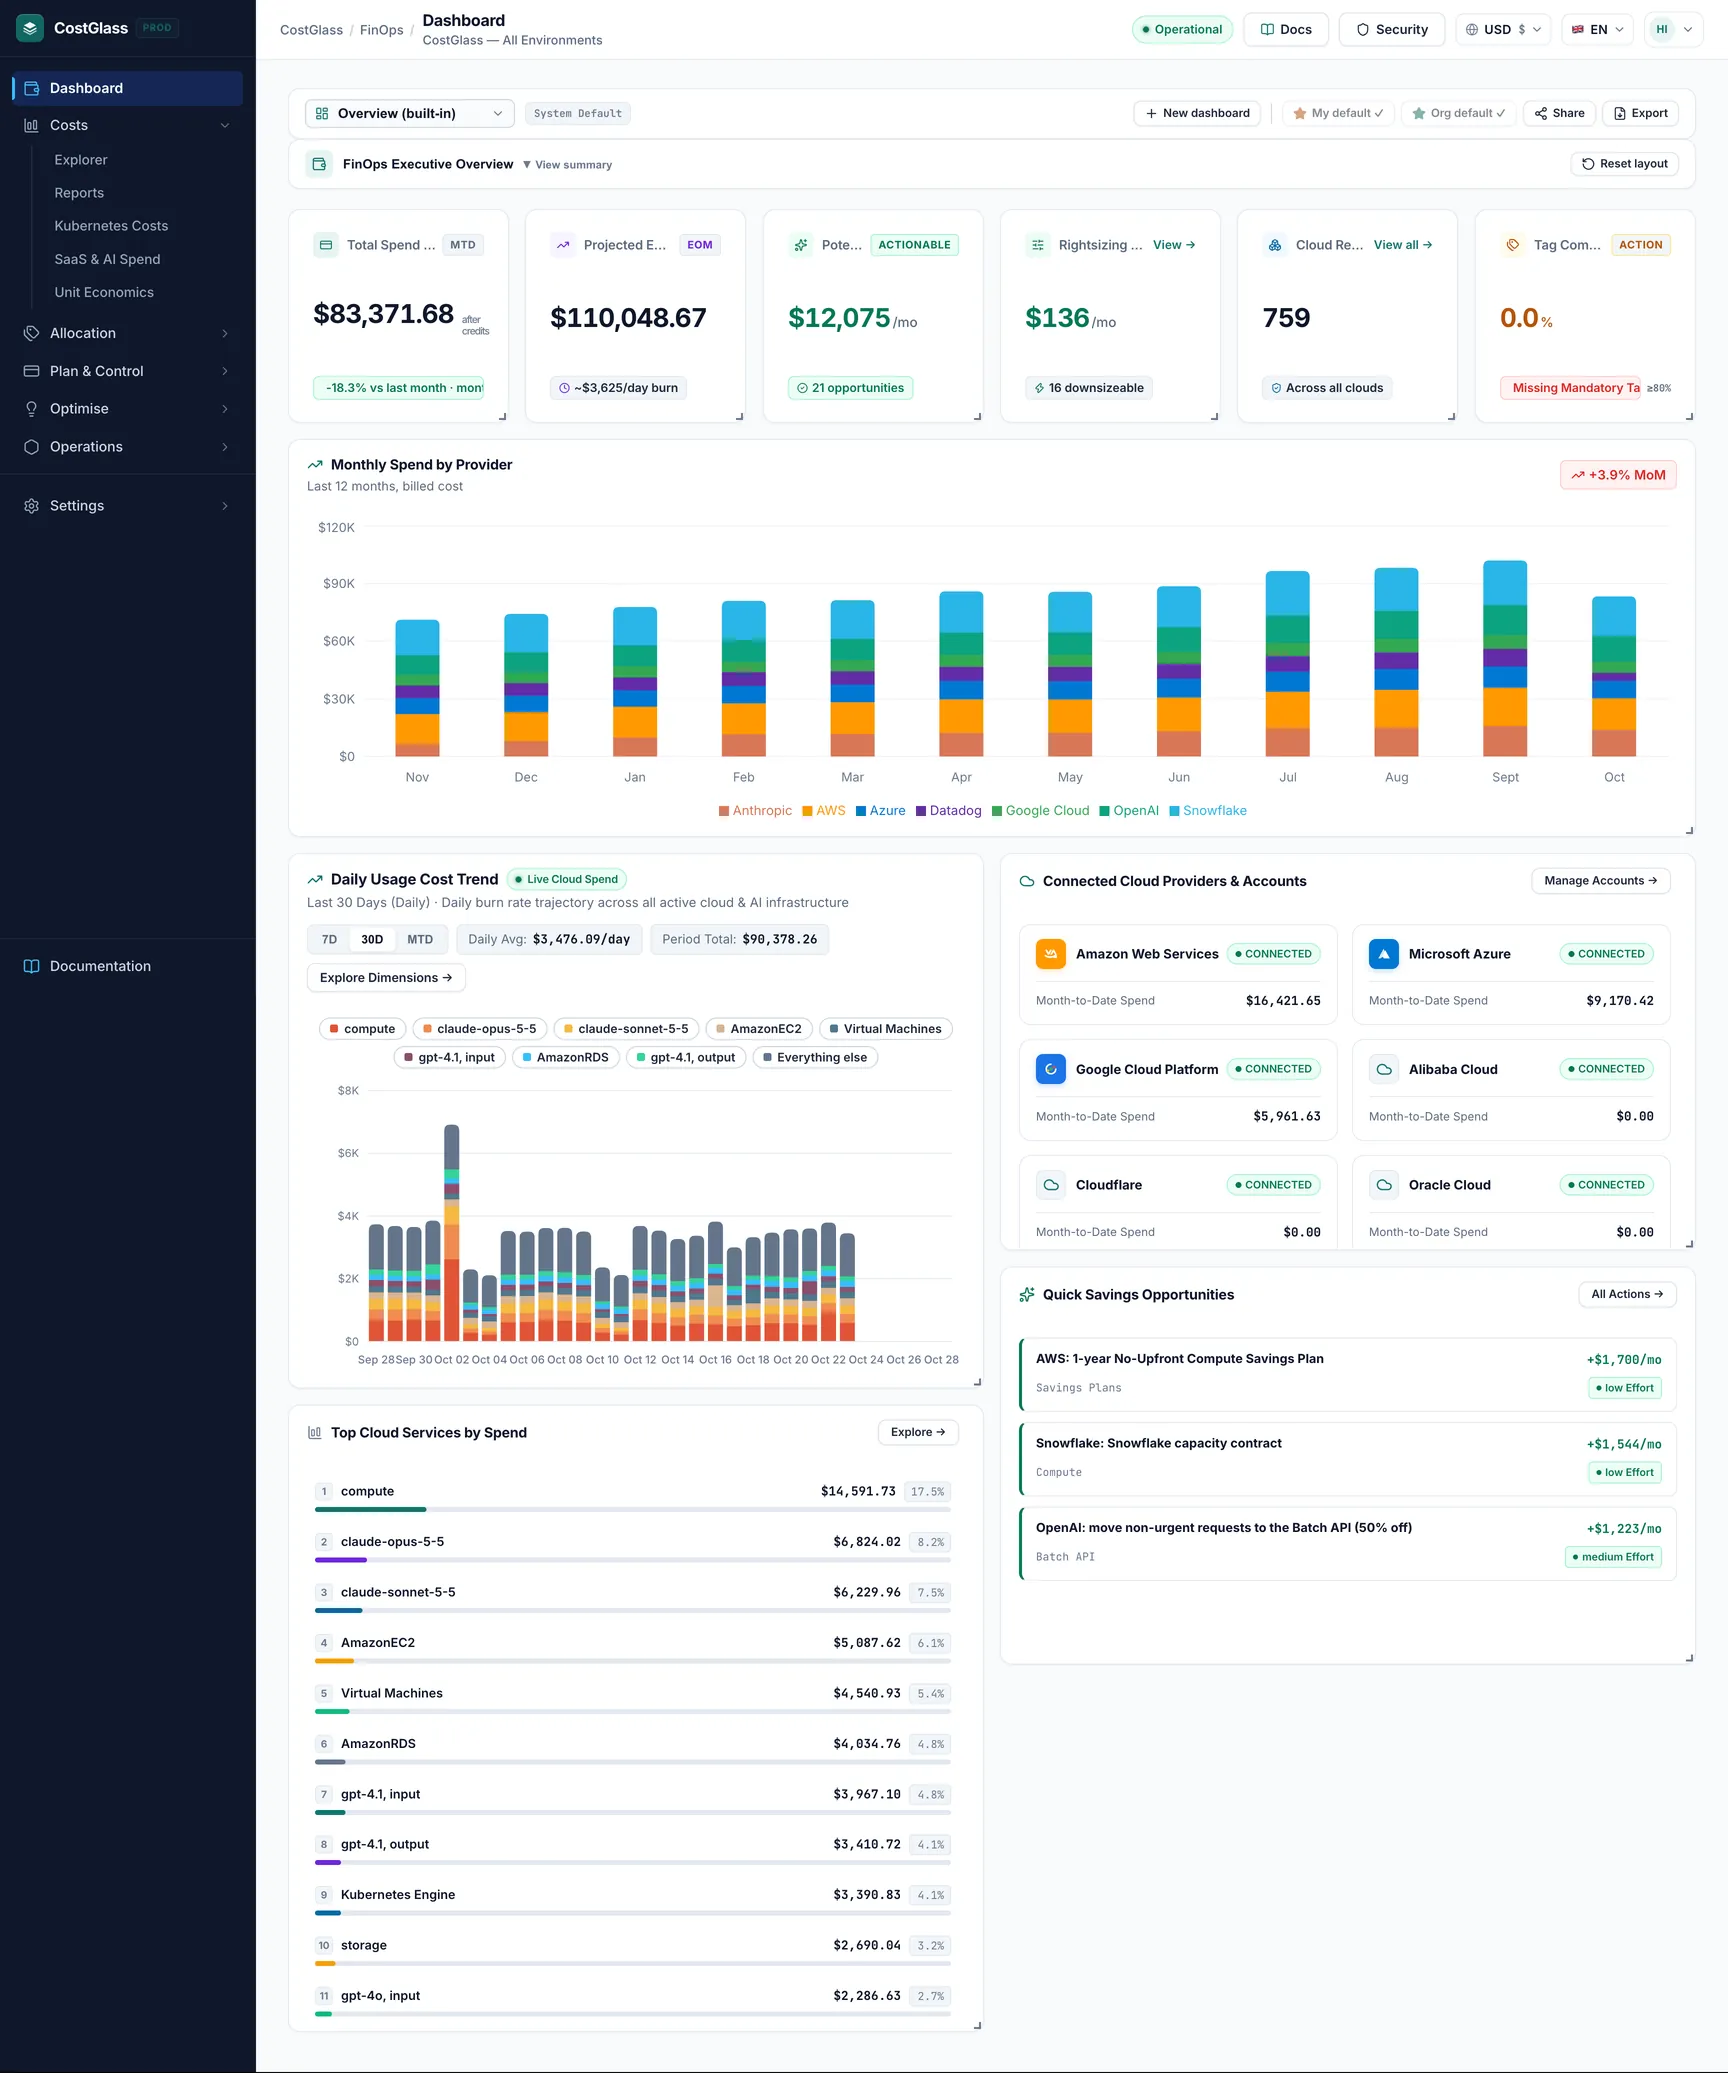
Dashboard open this page
Your month at a glance: spend to date across clouds and AI vendors, the projected month-end figure, potential savings, estimated rightsizing savings, how many cloud resources were found and your tag compliance. Below that are the daily cost trend, the quickest savings, and the clouds you have connected.
What to expect: Every card is a widget you can drag and resize; your layout is saved to your user, and Reset layout restores the default. A brand-new organisation looks empty until the first sync finishes, and the page offers a Fetch data now button in the meantime.
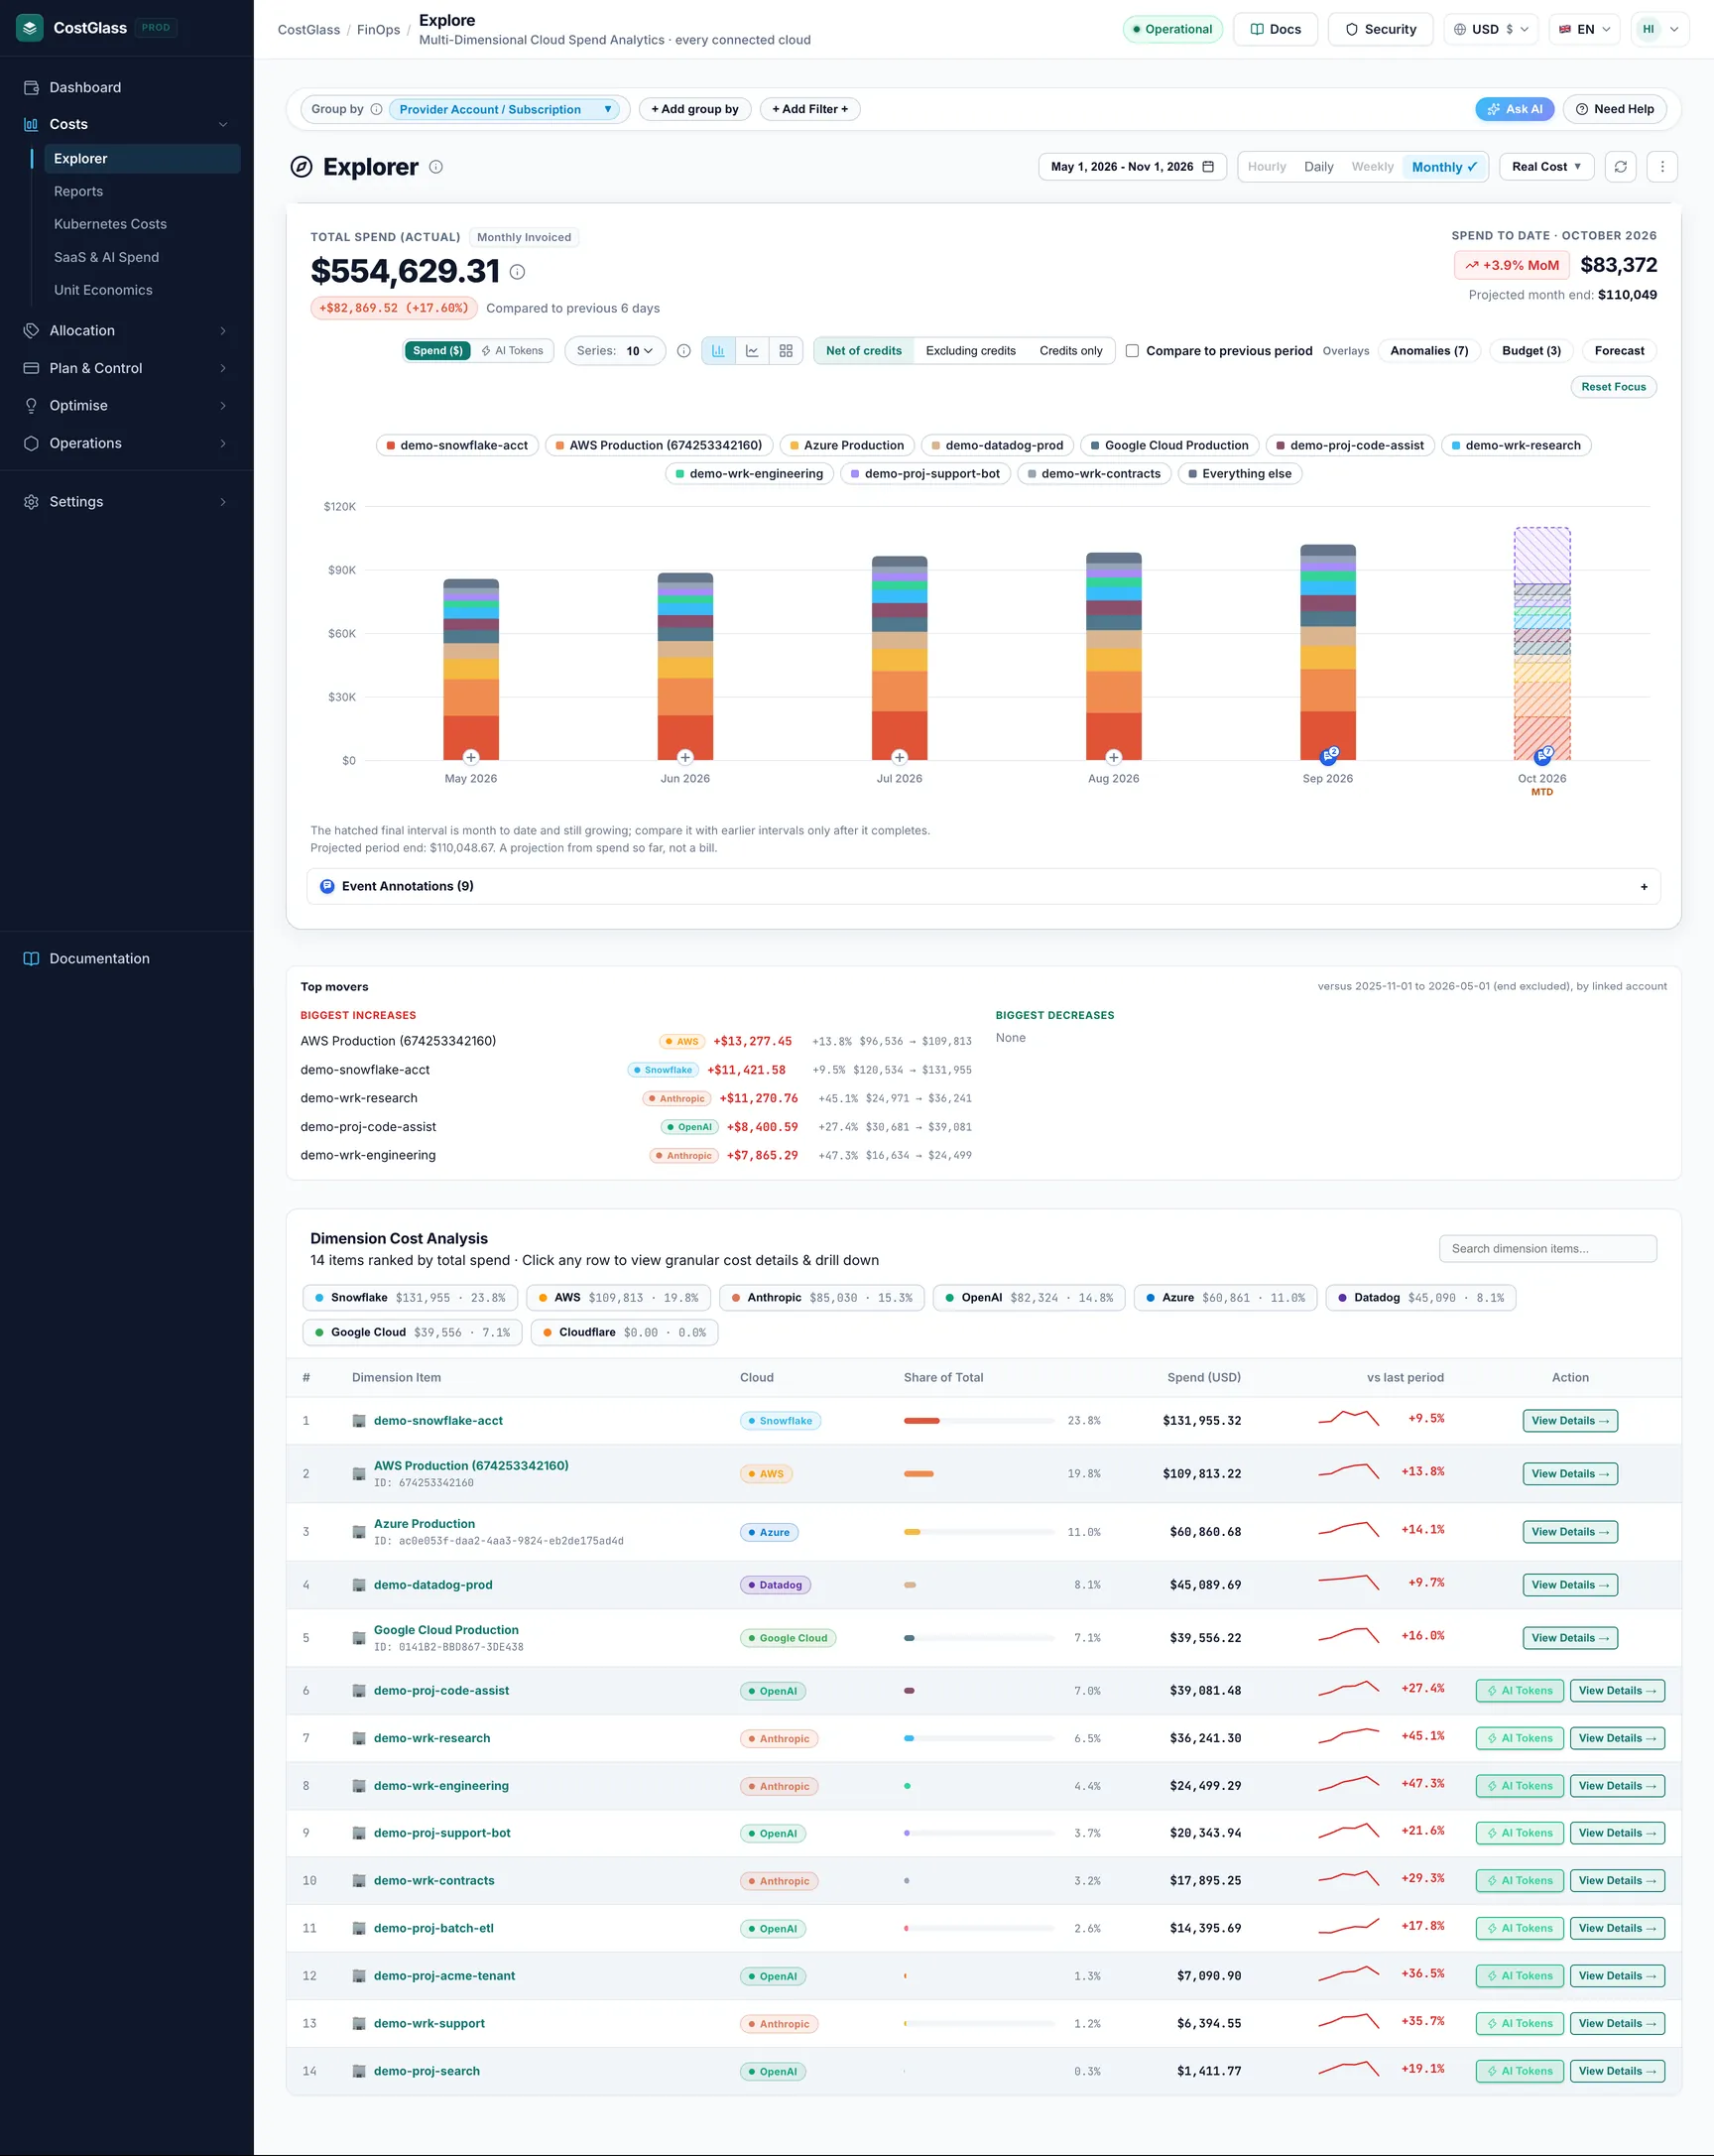
Cost Explorer open this page
Slice spend by service, account or subscription, region or tag, across every connected cloud. Filter by cloud, switch between unblended and amortized cost, and open the two-dimensional view to see, for example, service by region.
What to expect: Each line carries a cloud badge. Copy link puts your exact view in the address bar so a colleague opens the same thing, and CSV exports what you see.
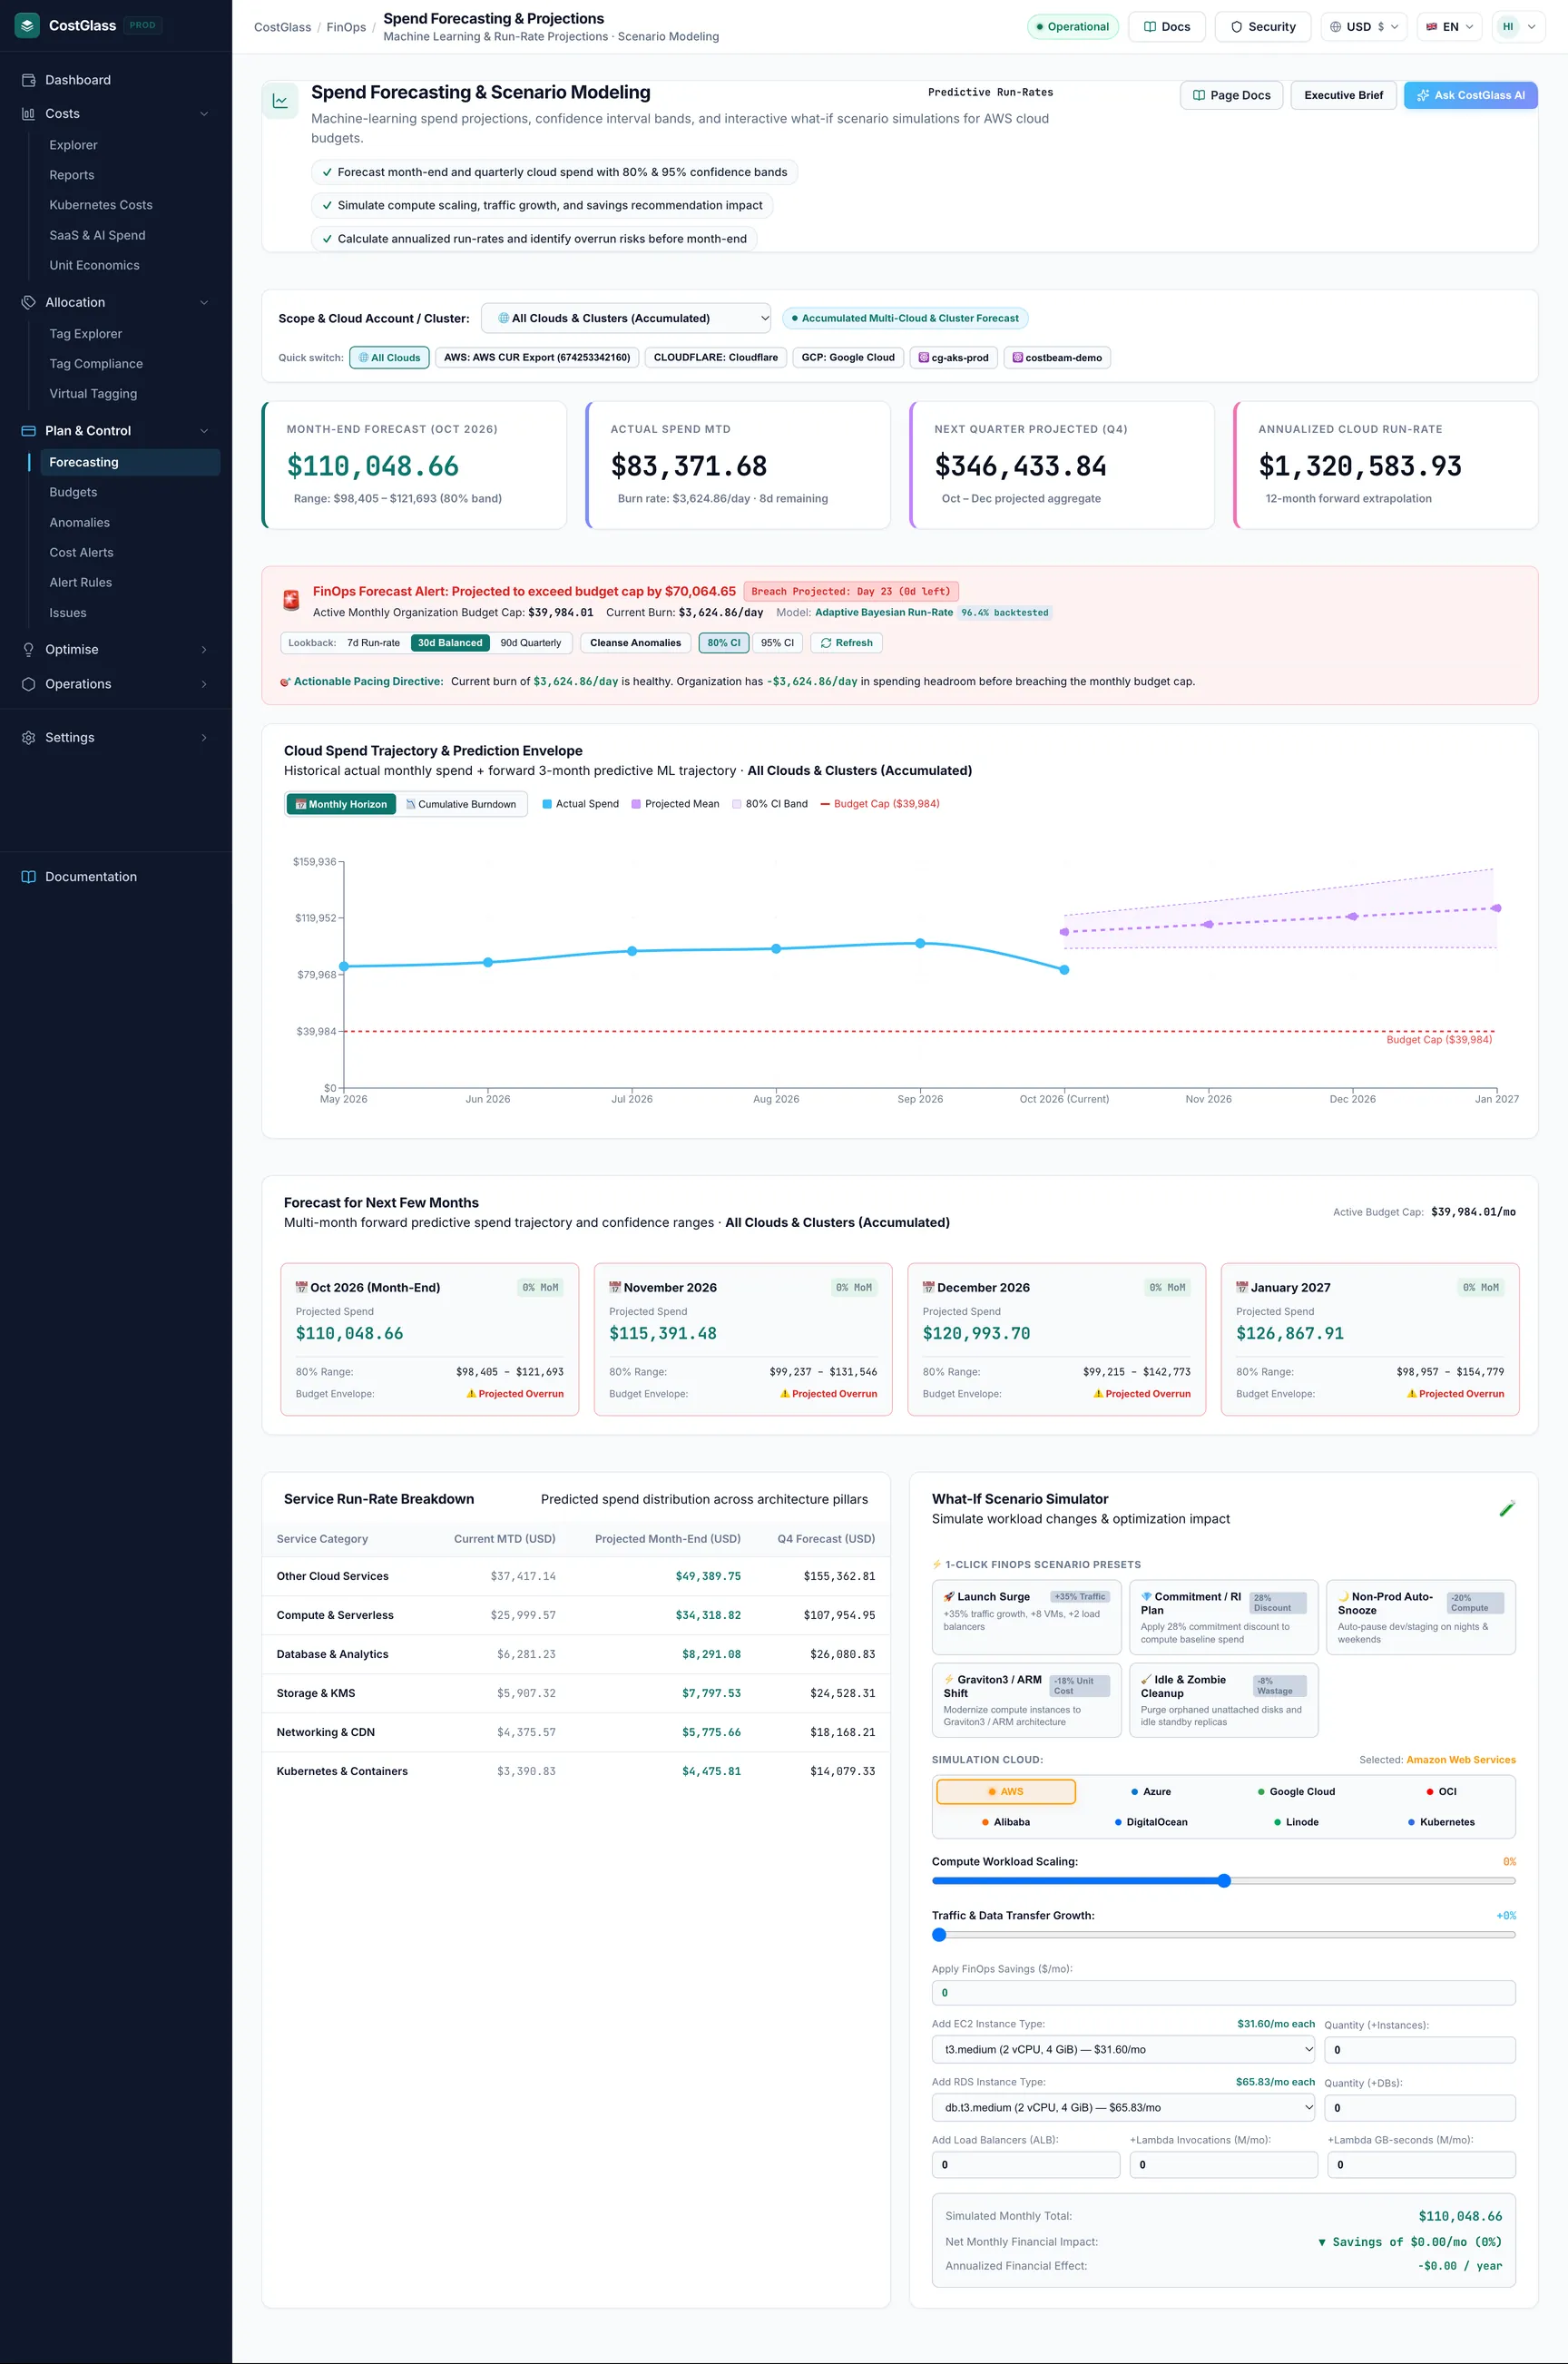
Forecasting open this page
Month-end and next-month projections with a confidence band, shown against your budget, plus a what-if simulator for adding instances, databases, load balancers or Lambda usage.
What to expect: Projections use your stored spend, so they improve as history accumulates.
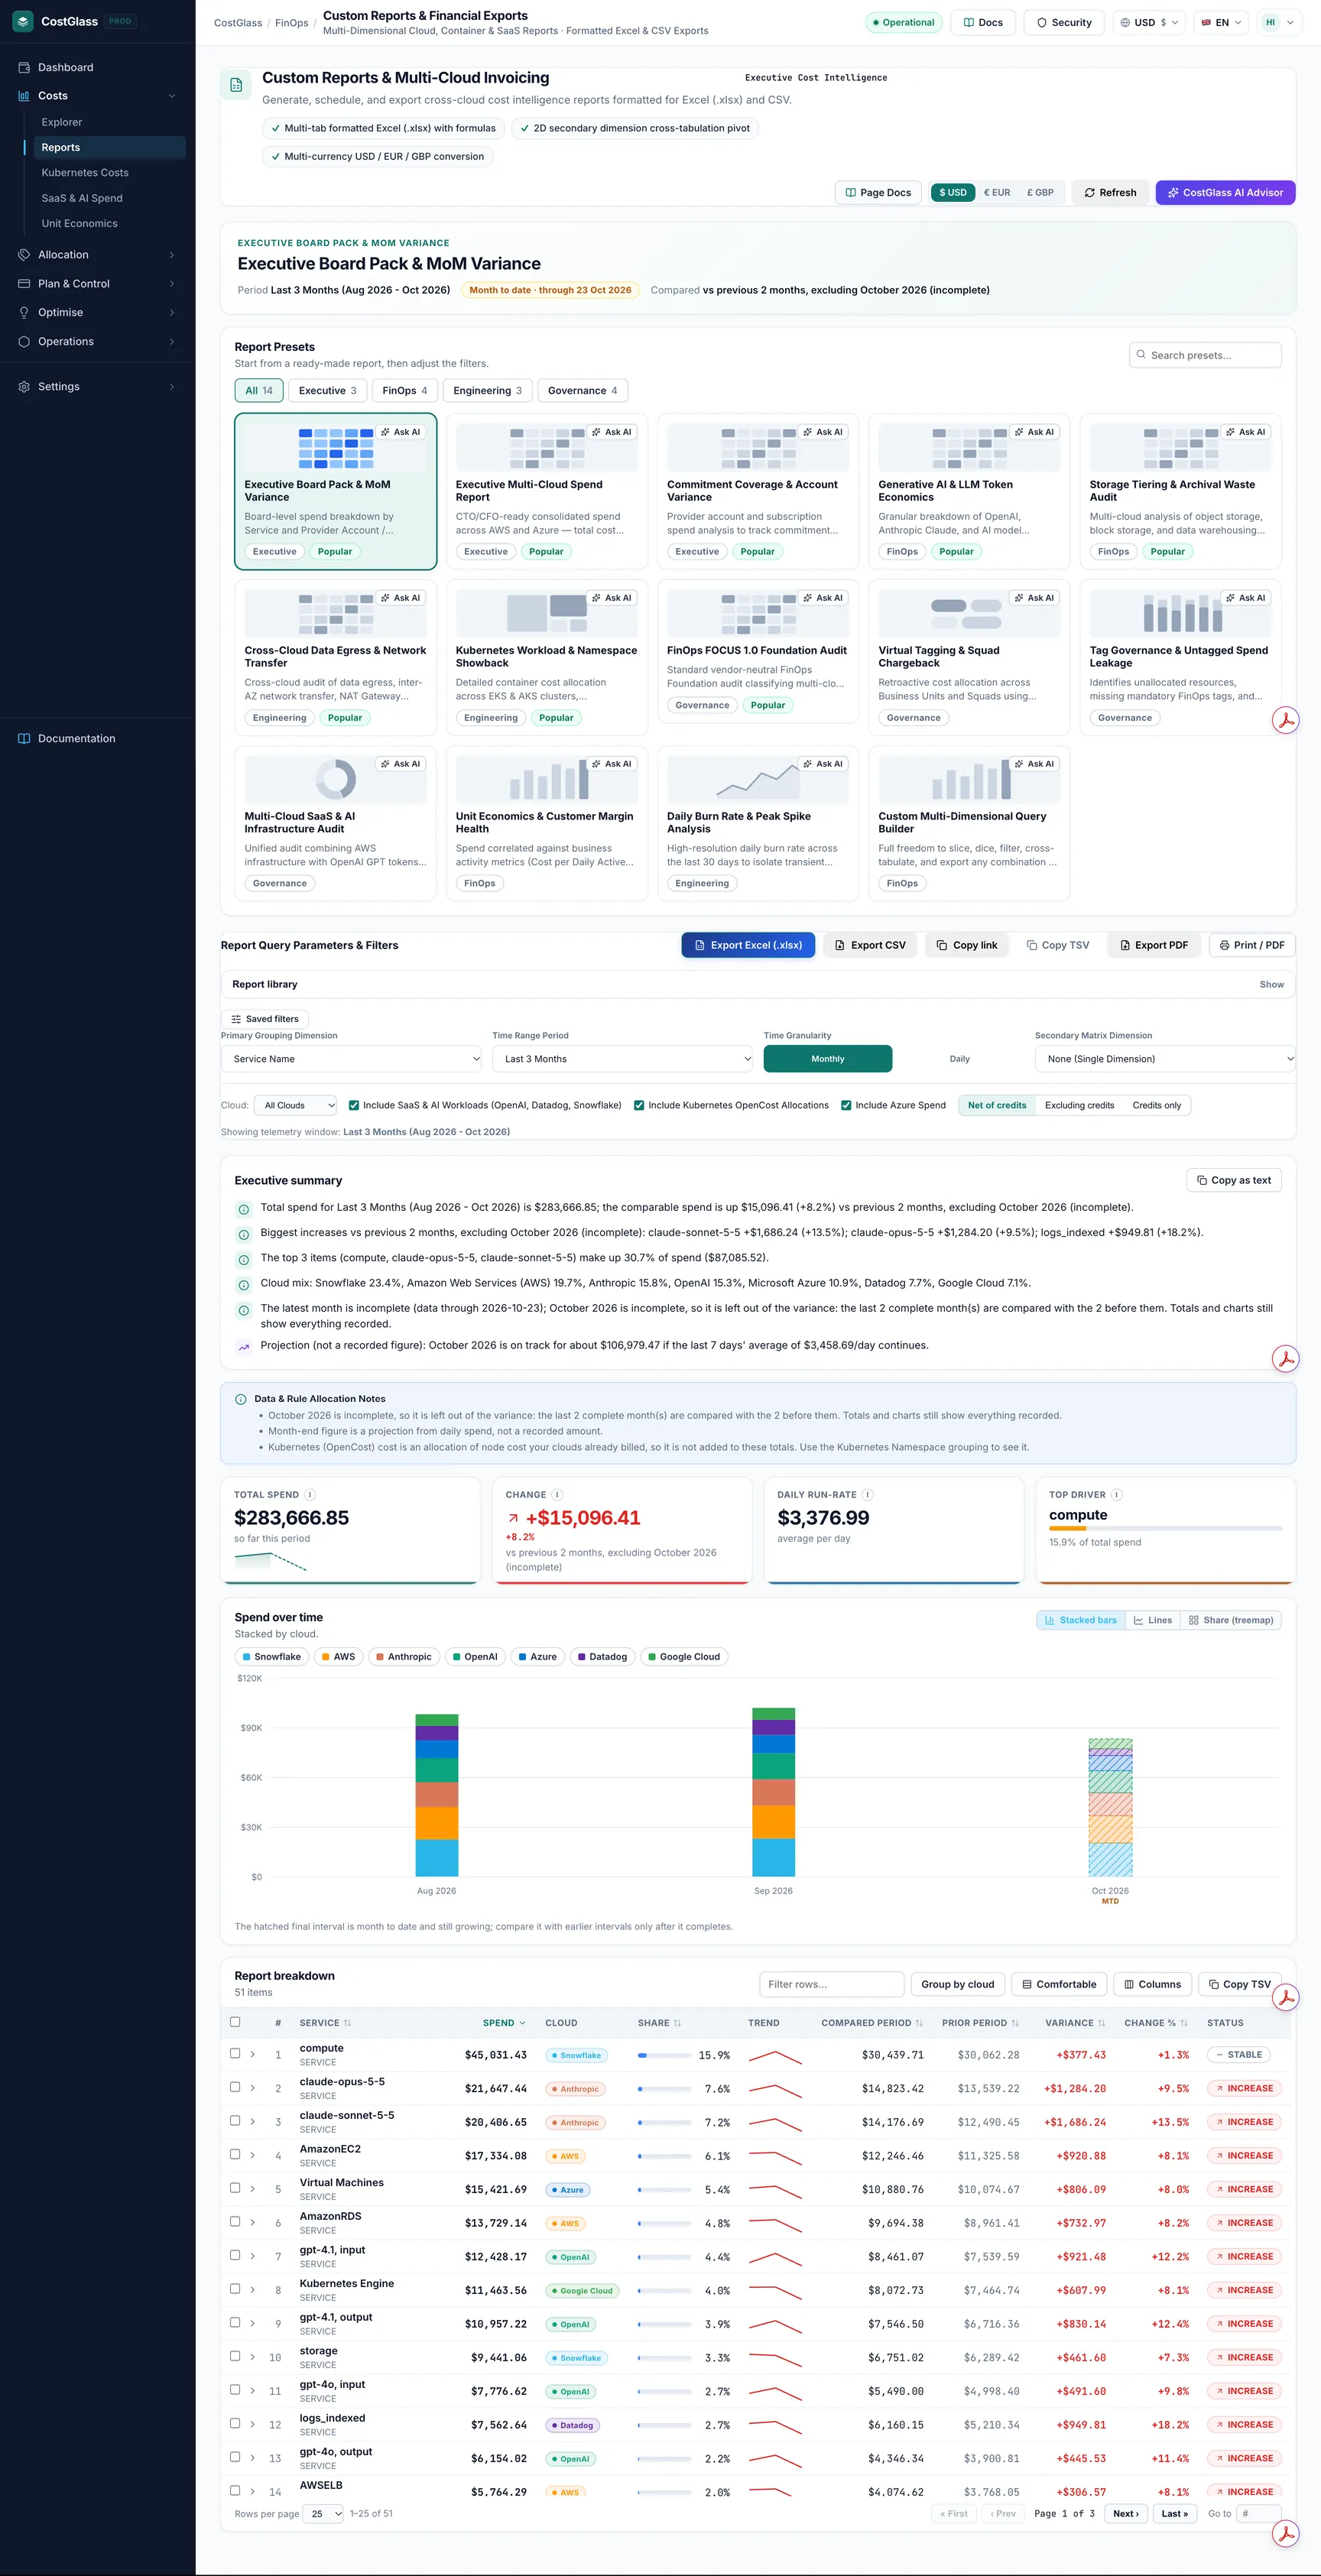
Reports open this page
Ready-made reports (board pack, multi-cloud spend, Kubernetes showback and others) and a custom report builder with two grouping dimensions and any date range.
What to expect: Short ranges such as last month show day by day; longer ranges show month by month. Export to Excel or CSV, or copy a link to the configured report.
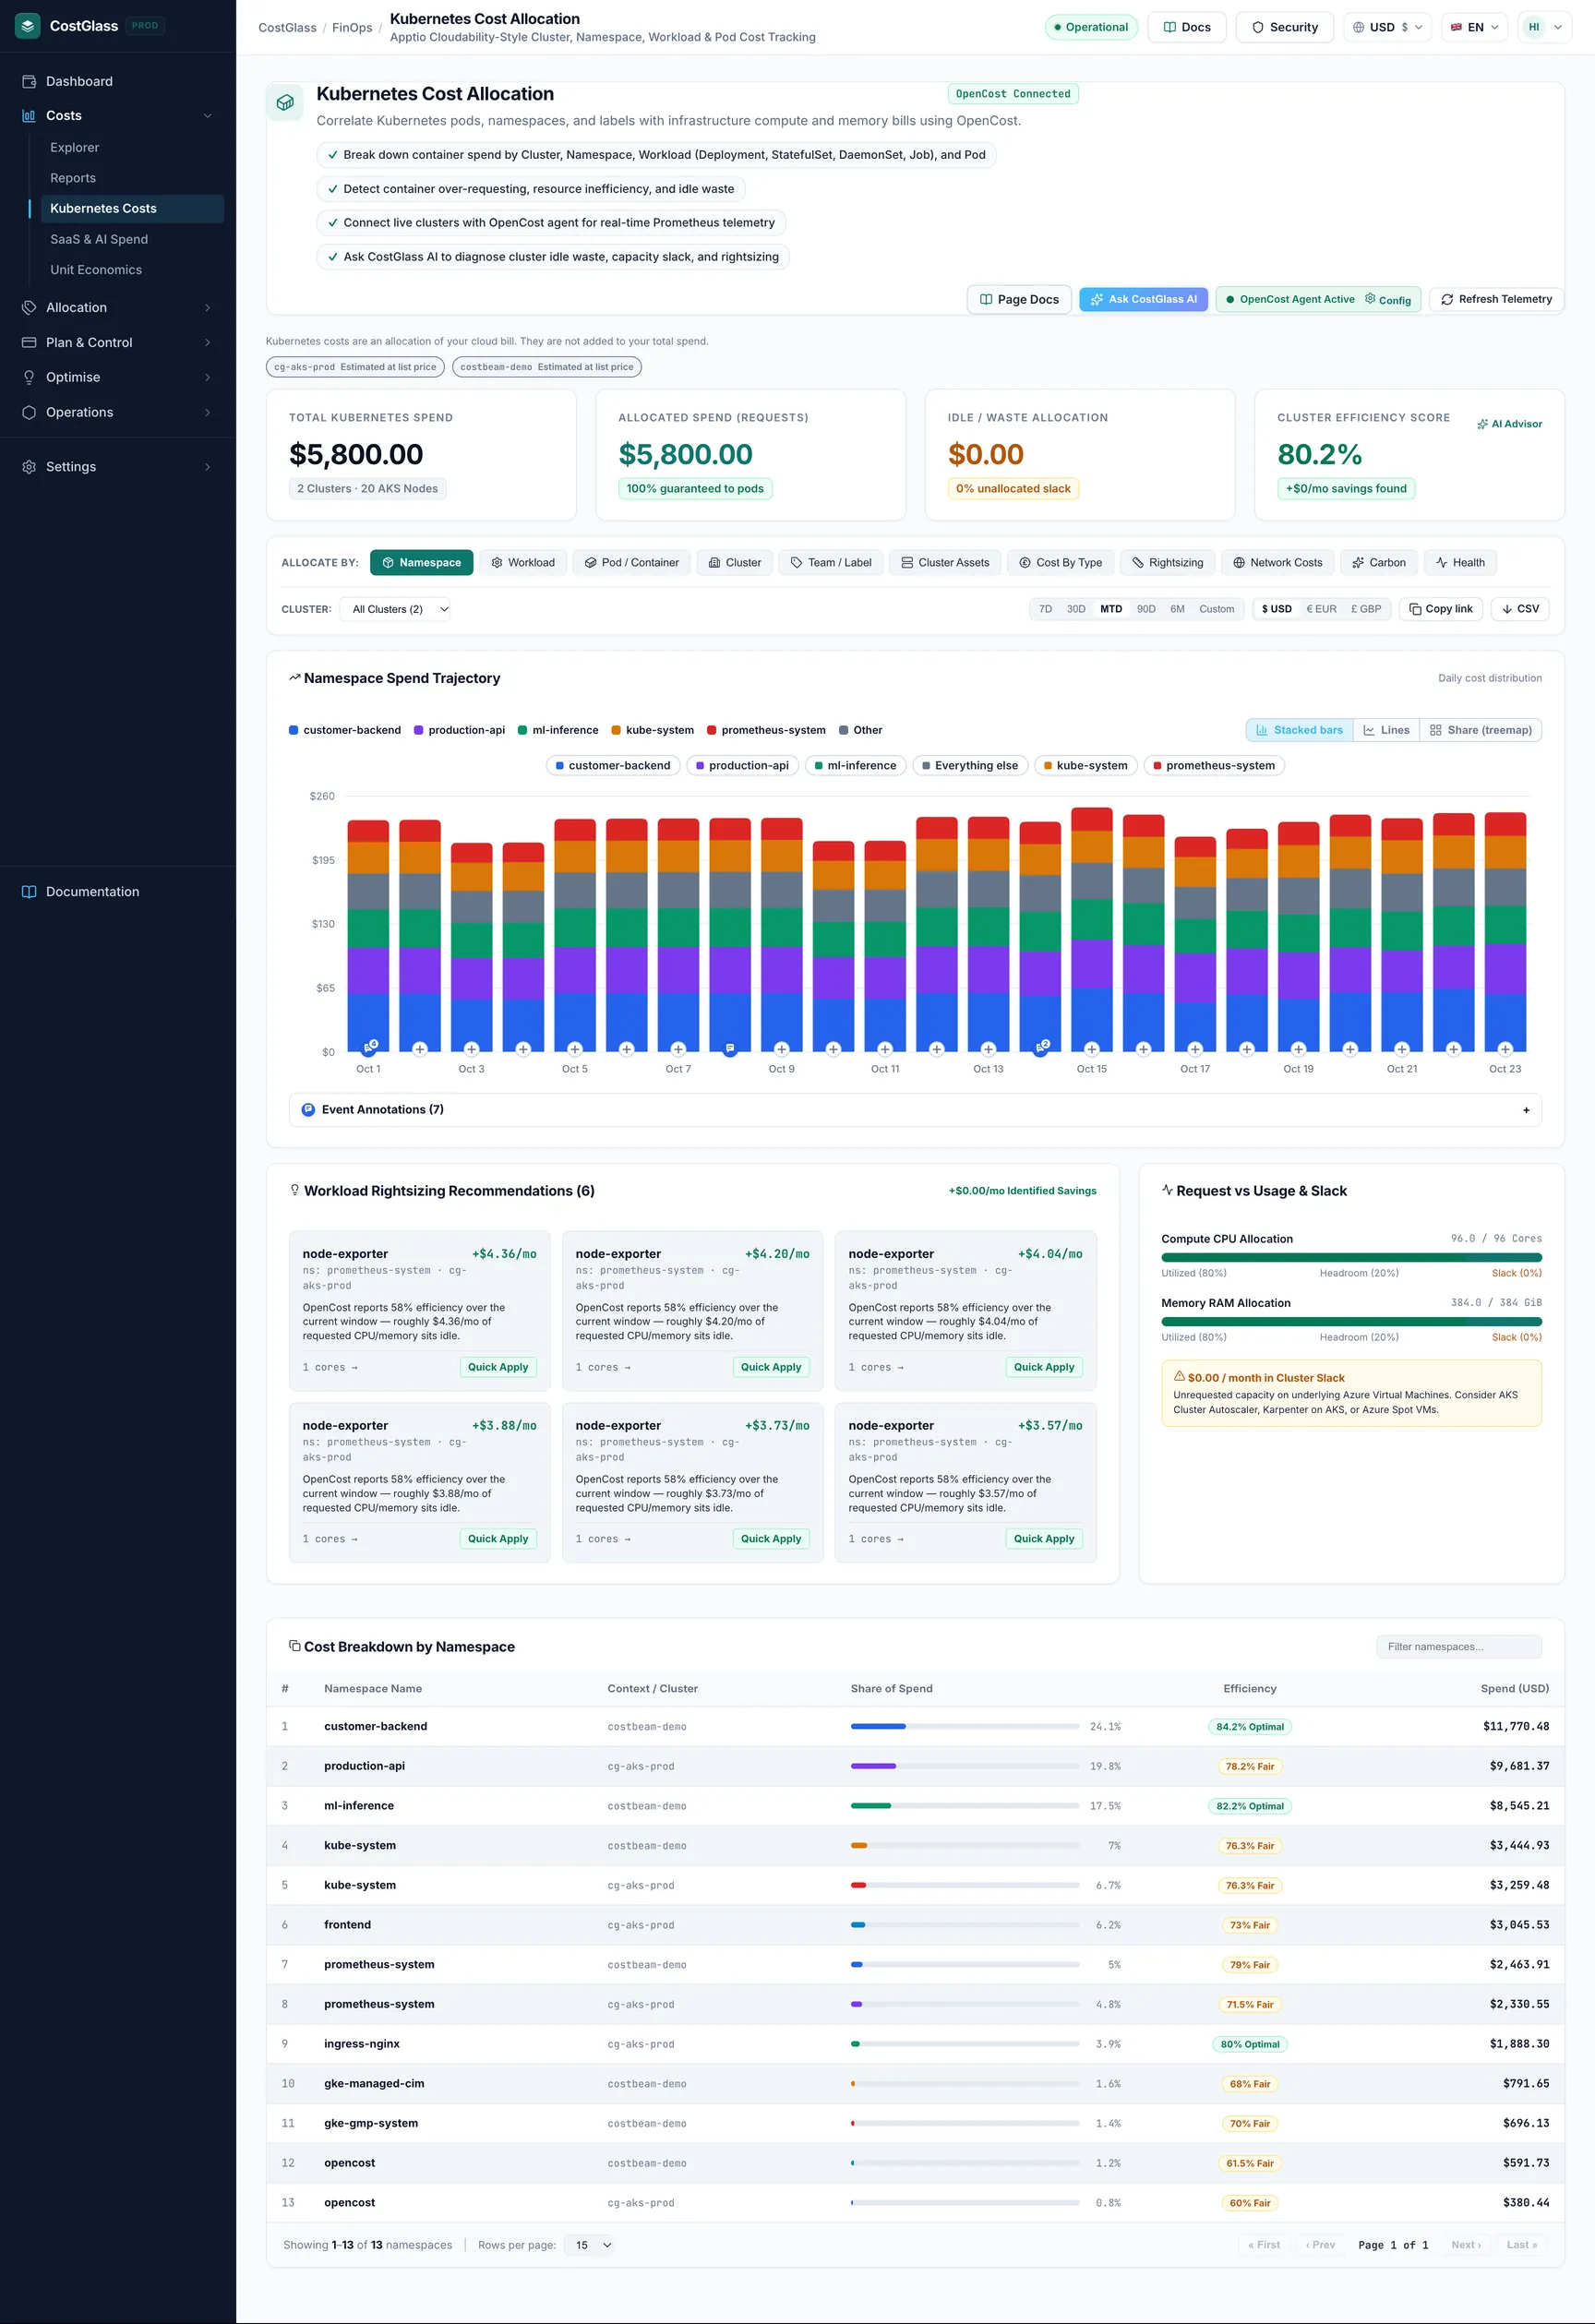
Kubernetes Costs open this page
Cost of your clusters allocated by namespace, workload (Deployments, StatefulSets, DaemonSets and Jobs), pod, cluster or label, with tabs for cluster assets, cost by type, rightsizing, network costs, carbon and cluster health.
What to expect: Needs the CostGlass agent in each cluster (see Kubernetes cost allocation). The Health and Carbon tabs need the full manifest; they stay empty rather than guessed if it is not applied.
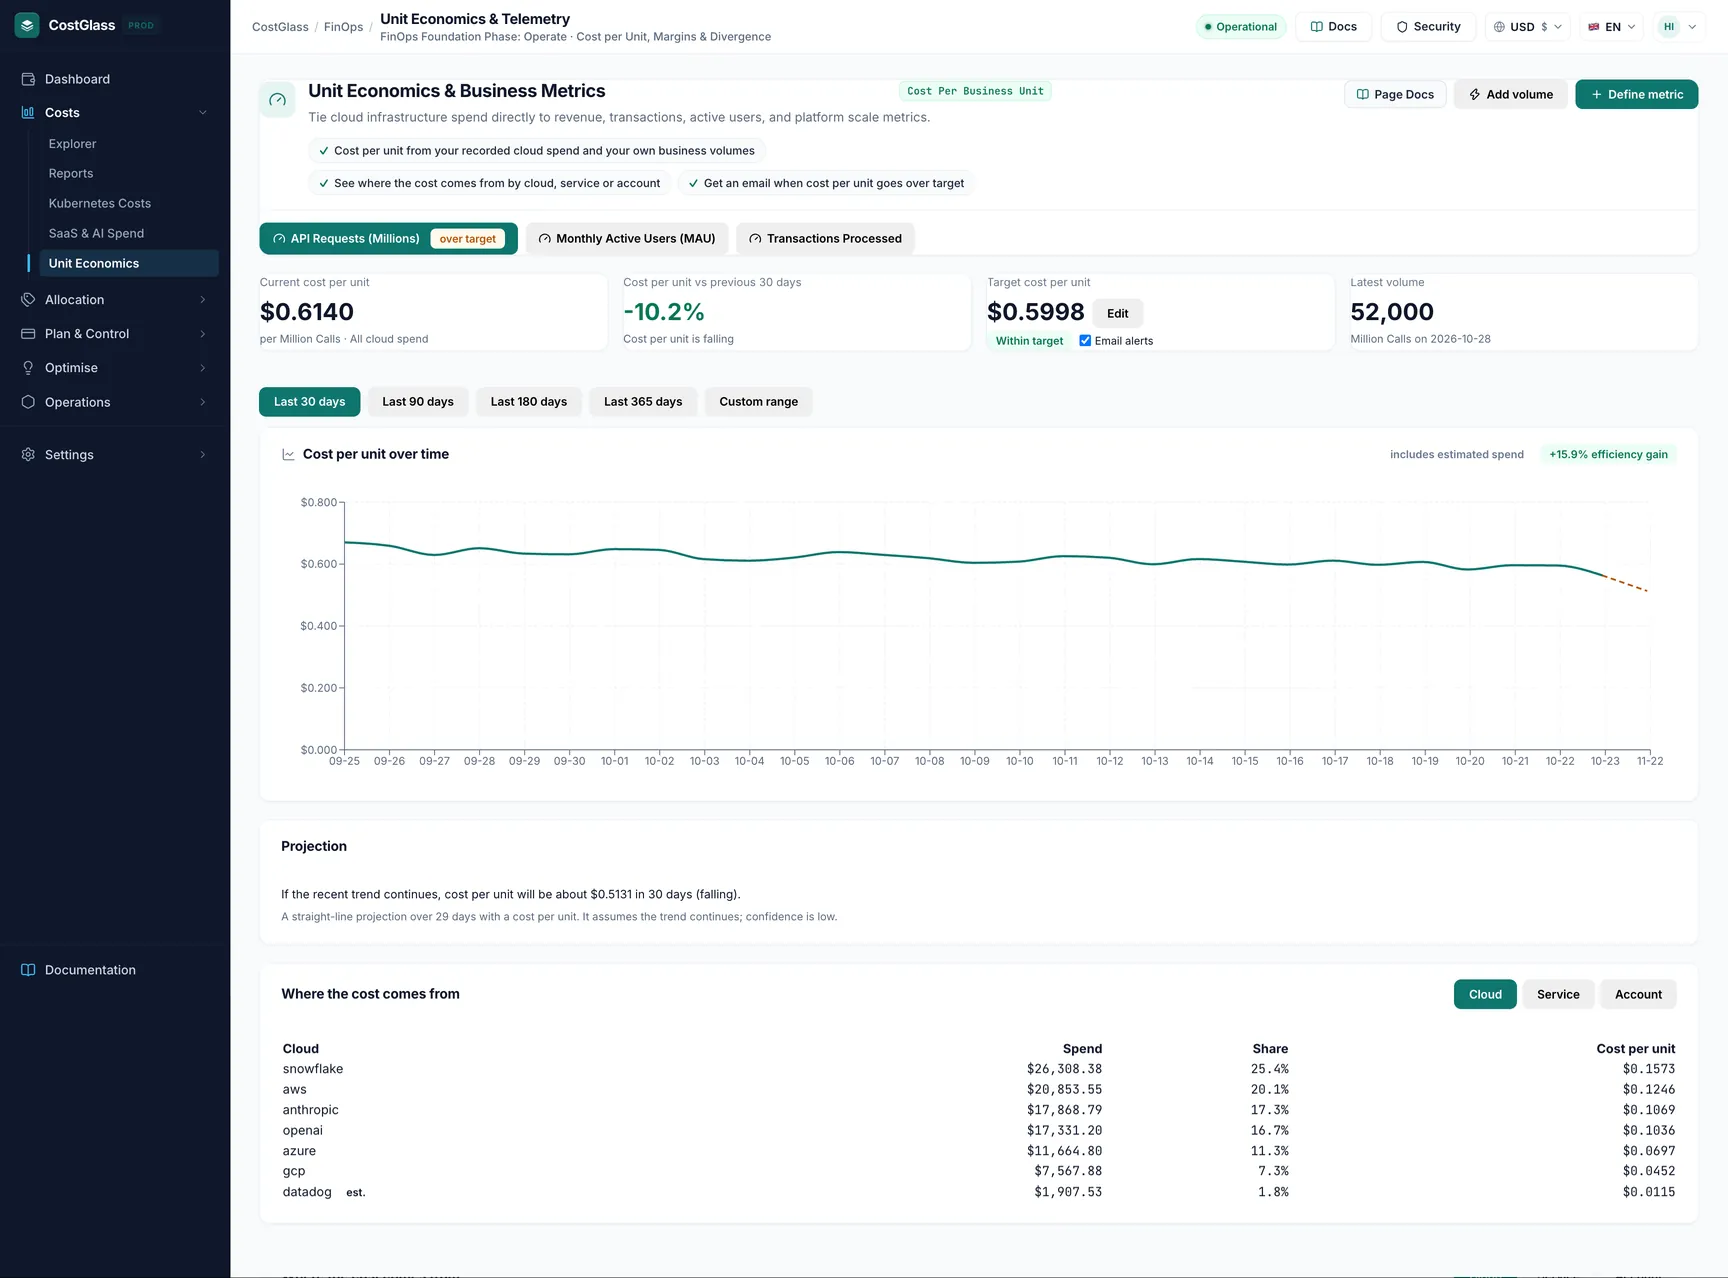
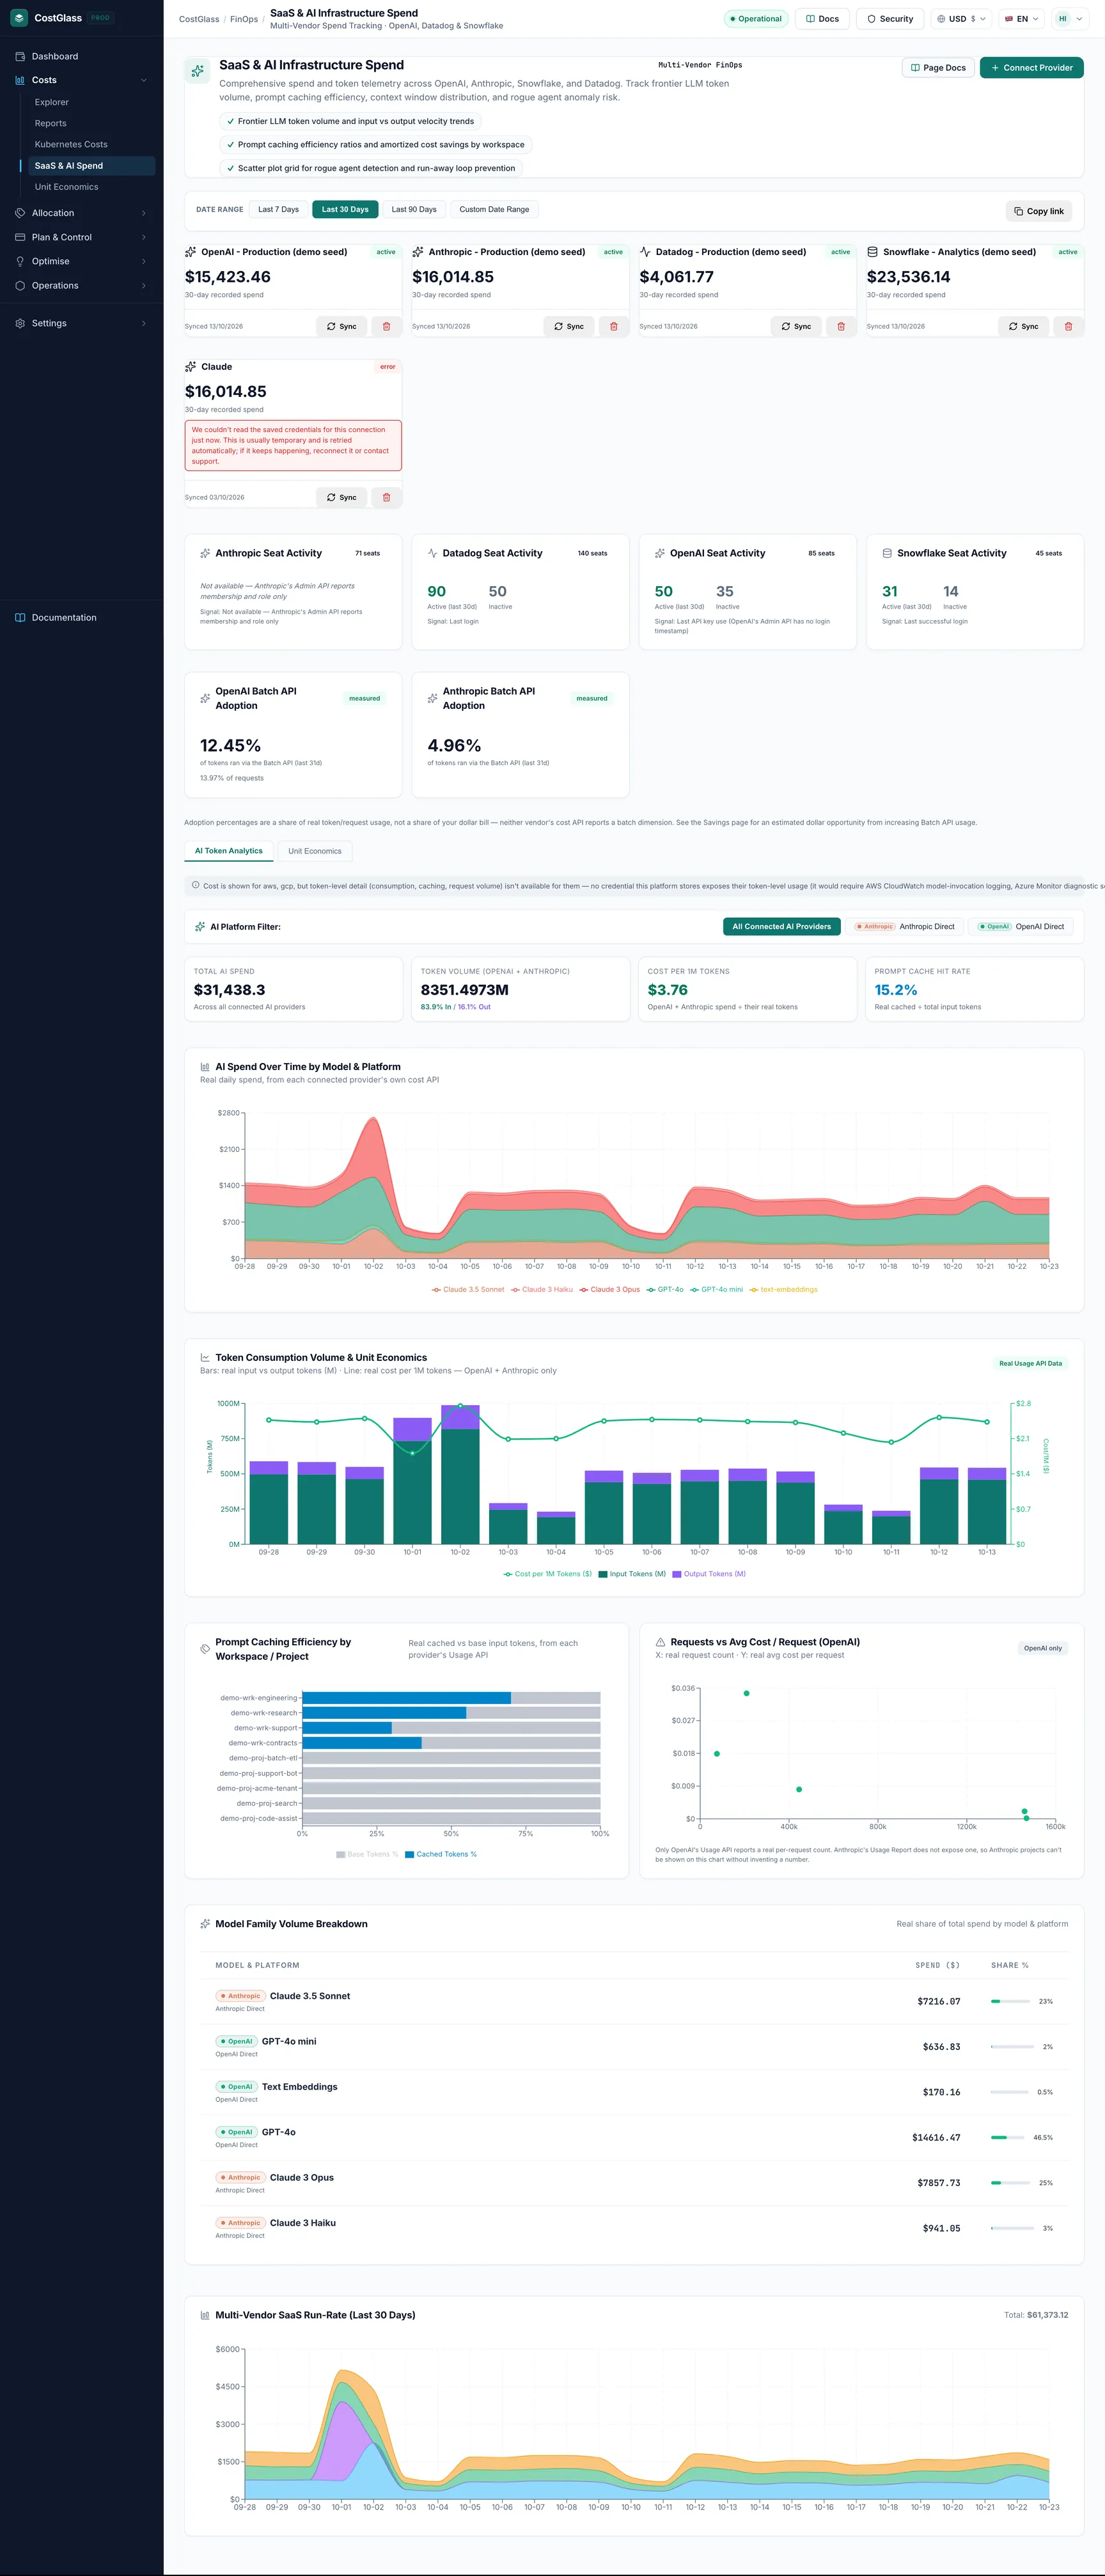
Allocation & governance
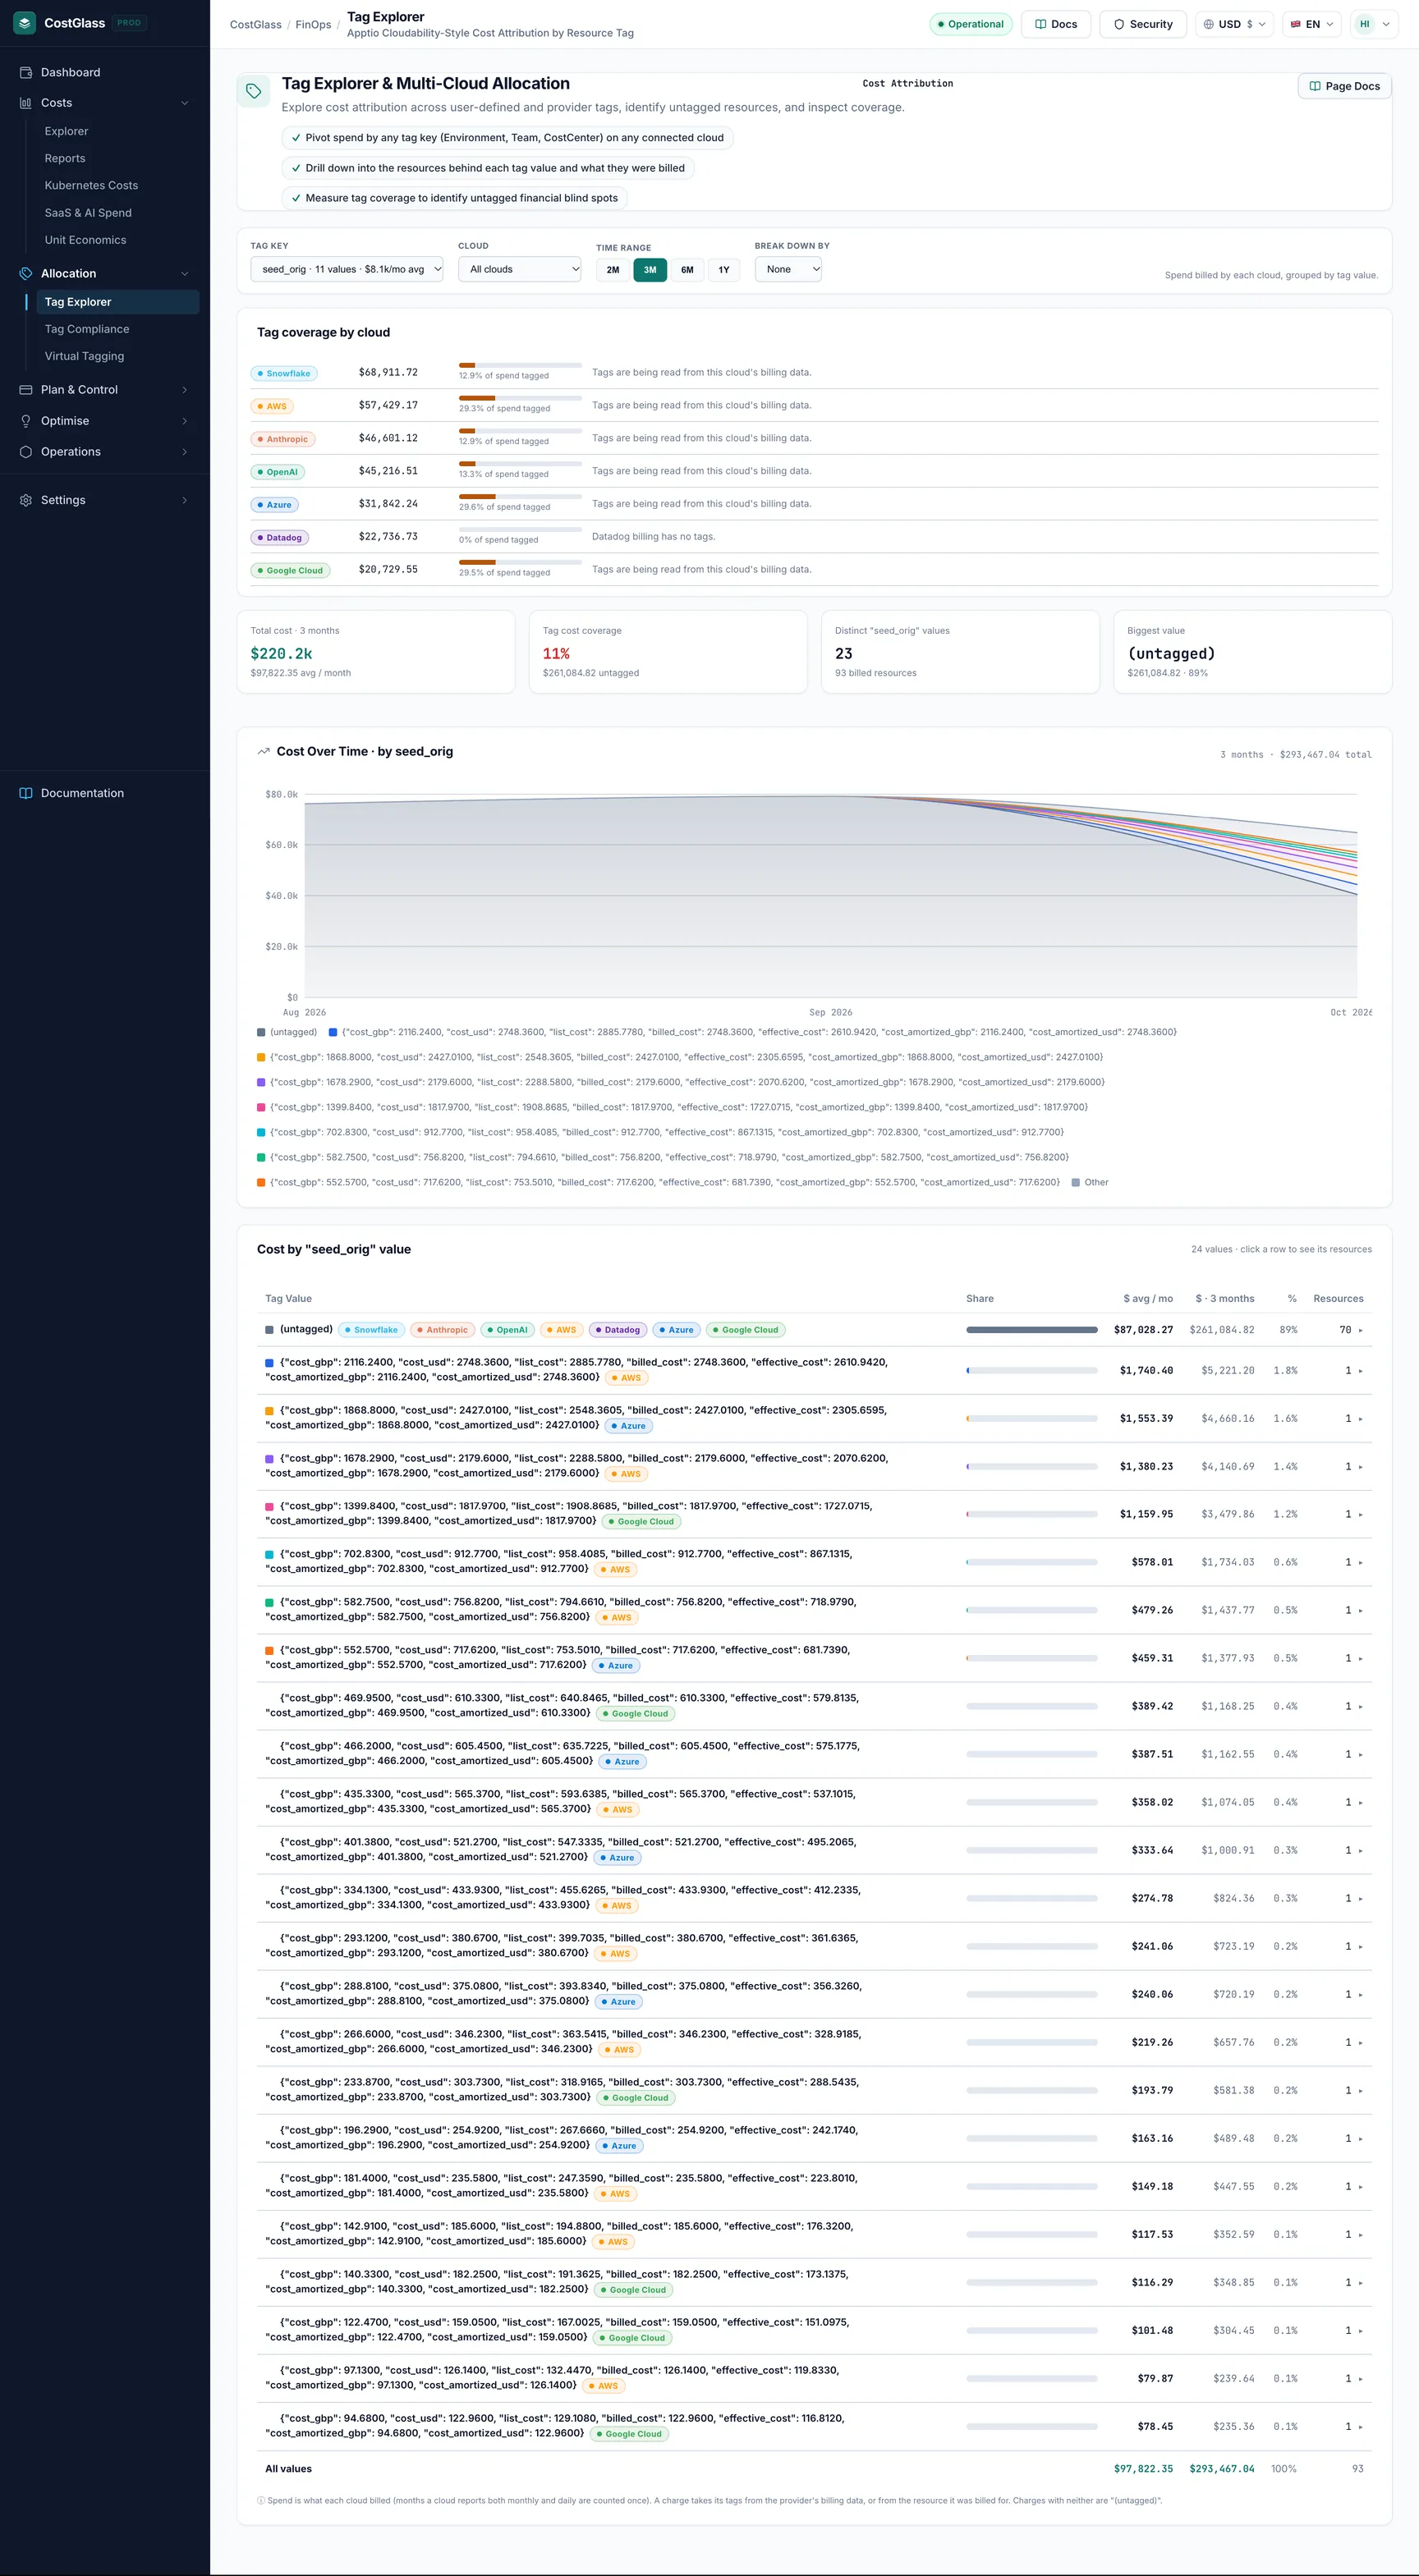
Tag Explorer open this page
Spend broken down by any cost-allocation tag you have, with the untagged remainder called out.
What to expect: Only tags activated for cost allocation in your cloud appear.
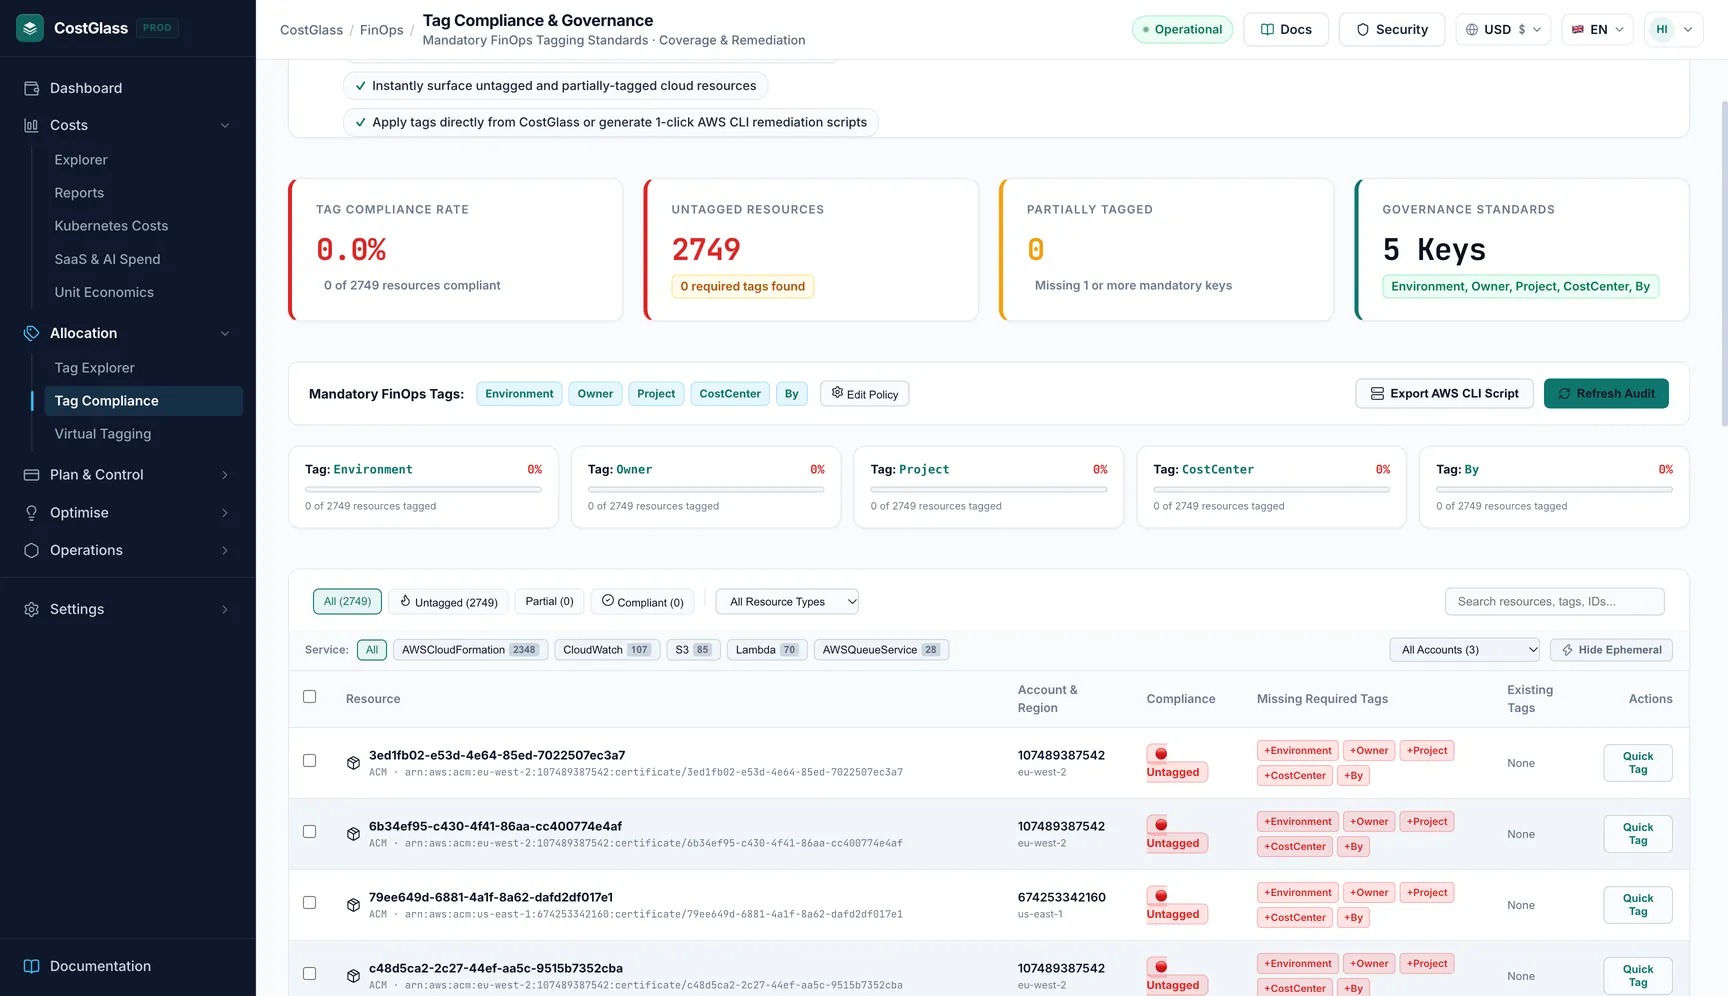
Tag Compliance open this page
Which resources are missing the tags your policy requires, with a compliance score and a fix script.
What to expect: Compliance is measured against the mandatory tags you set.
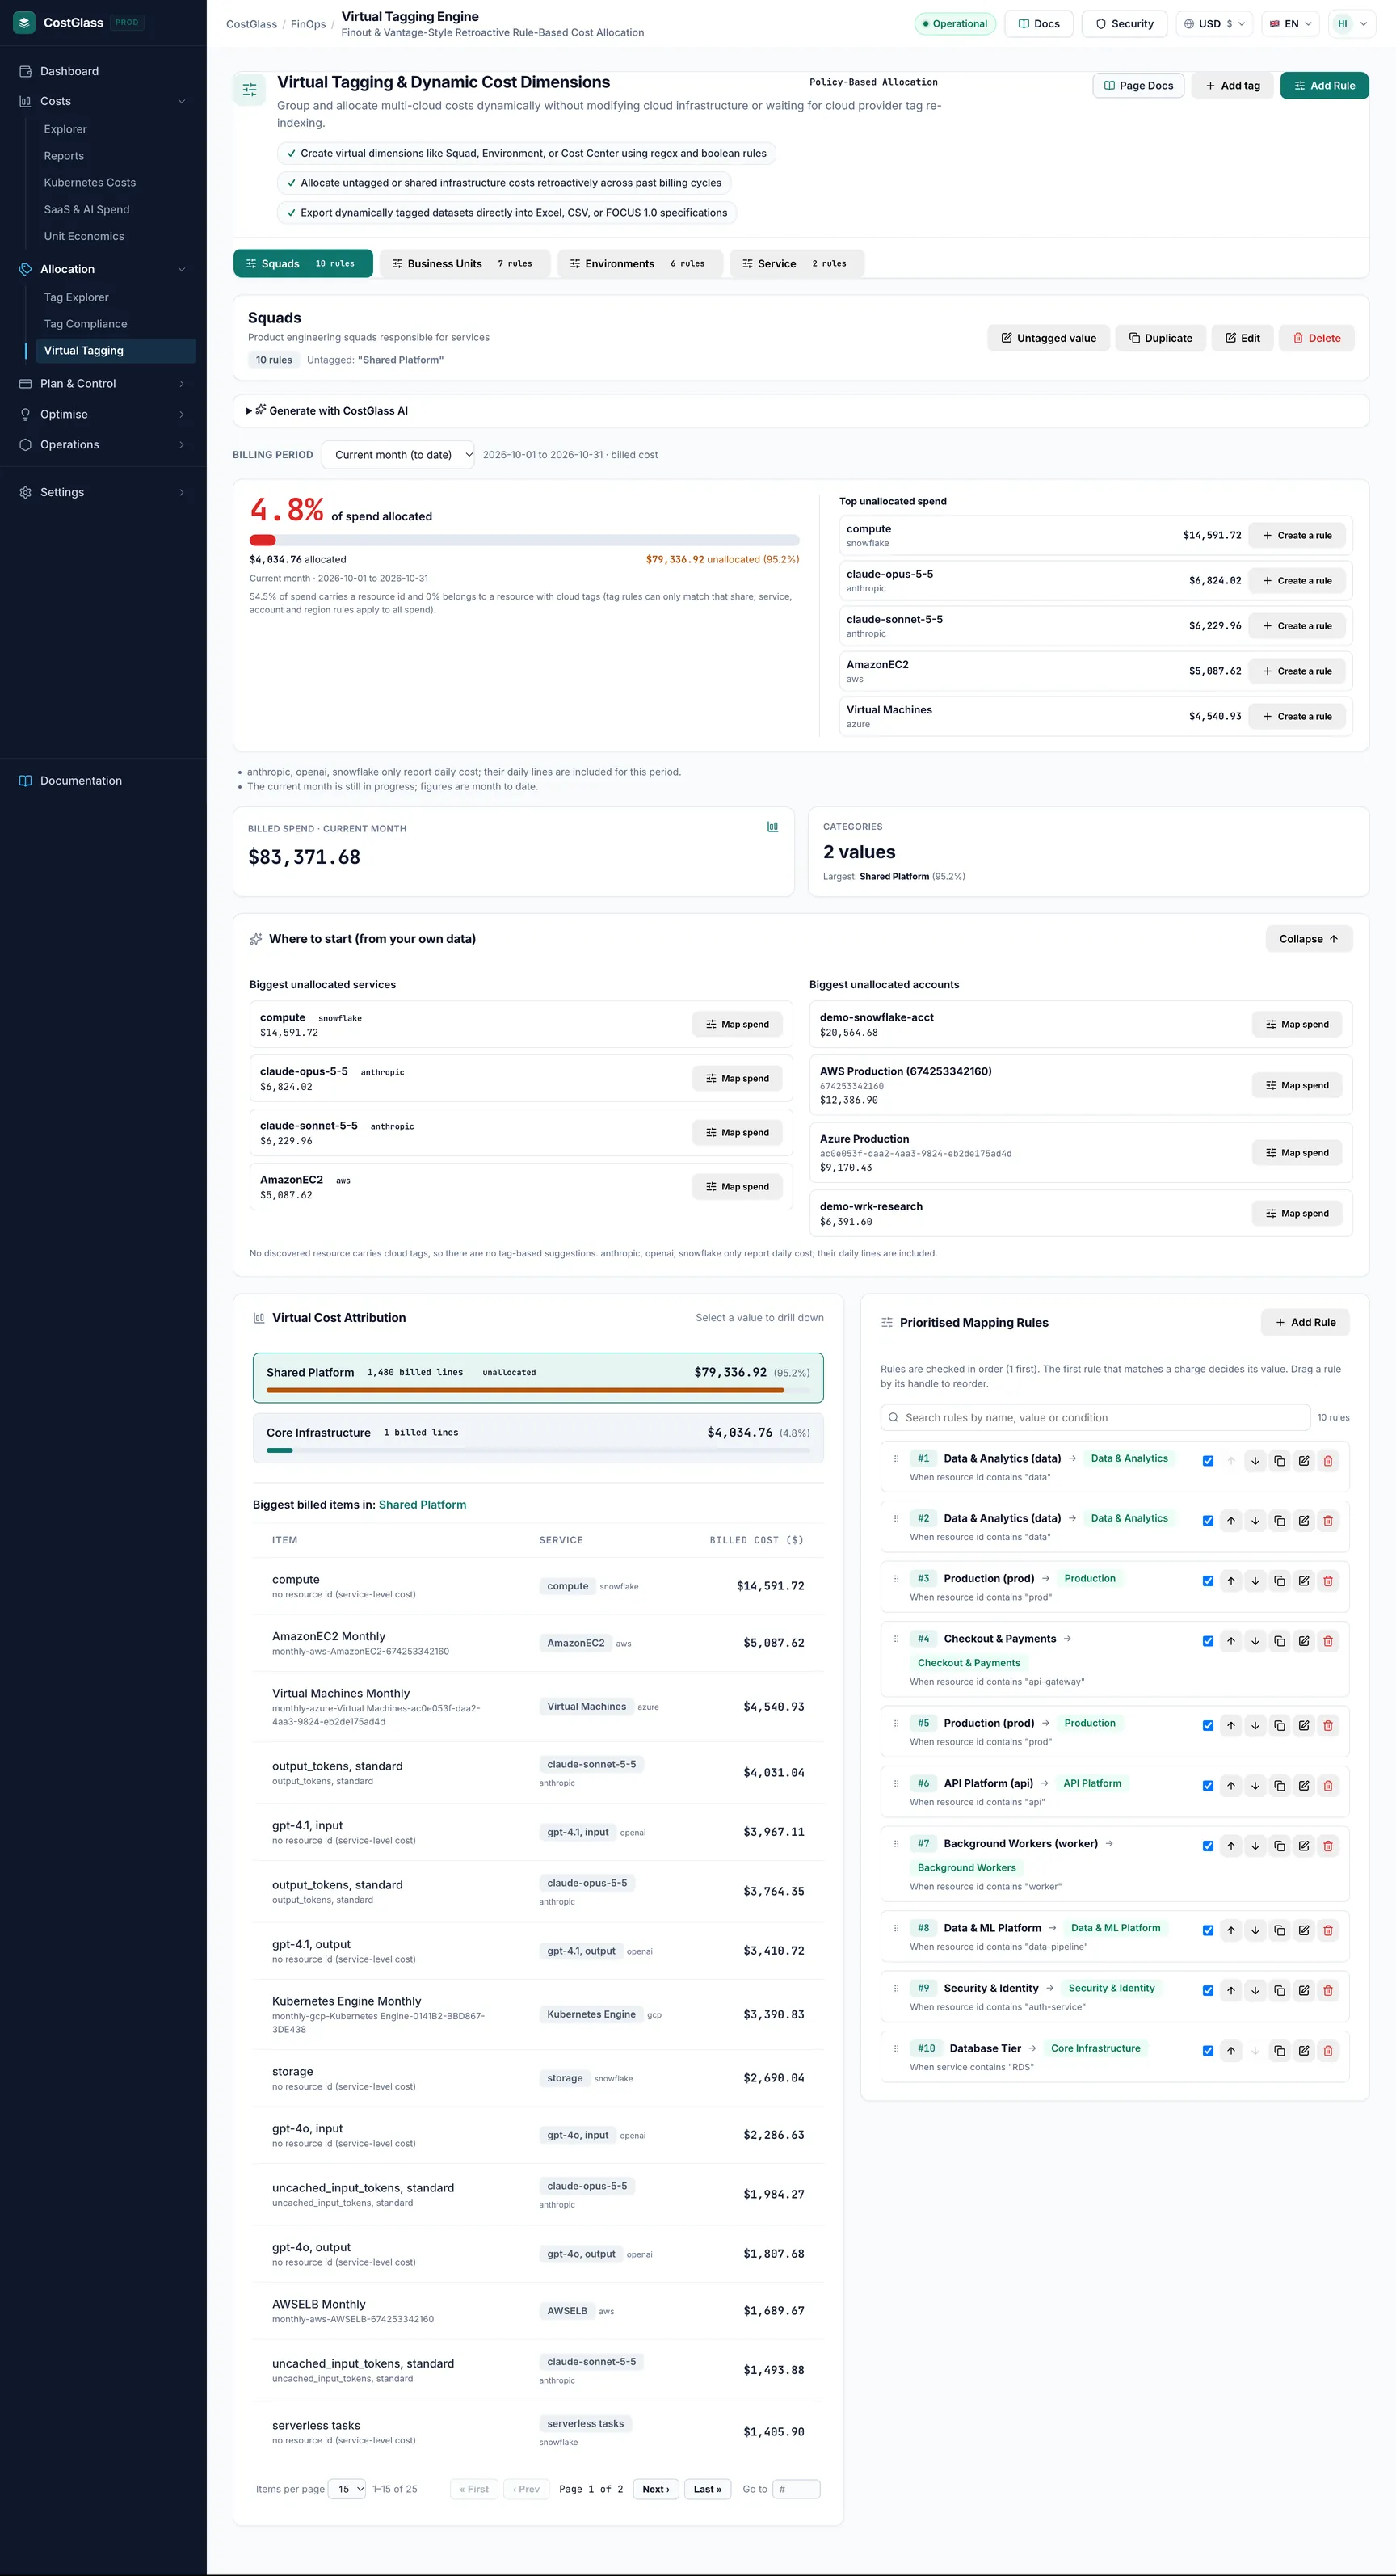
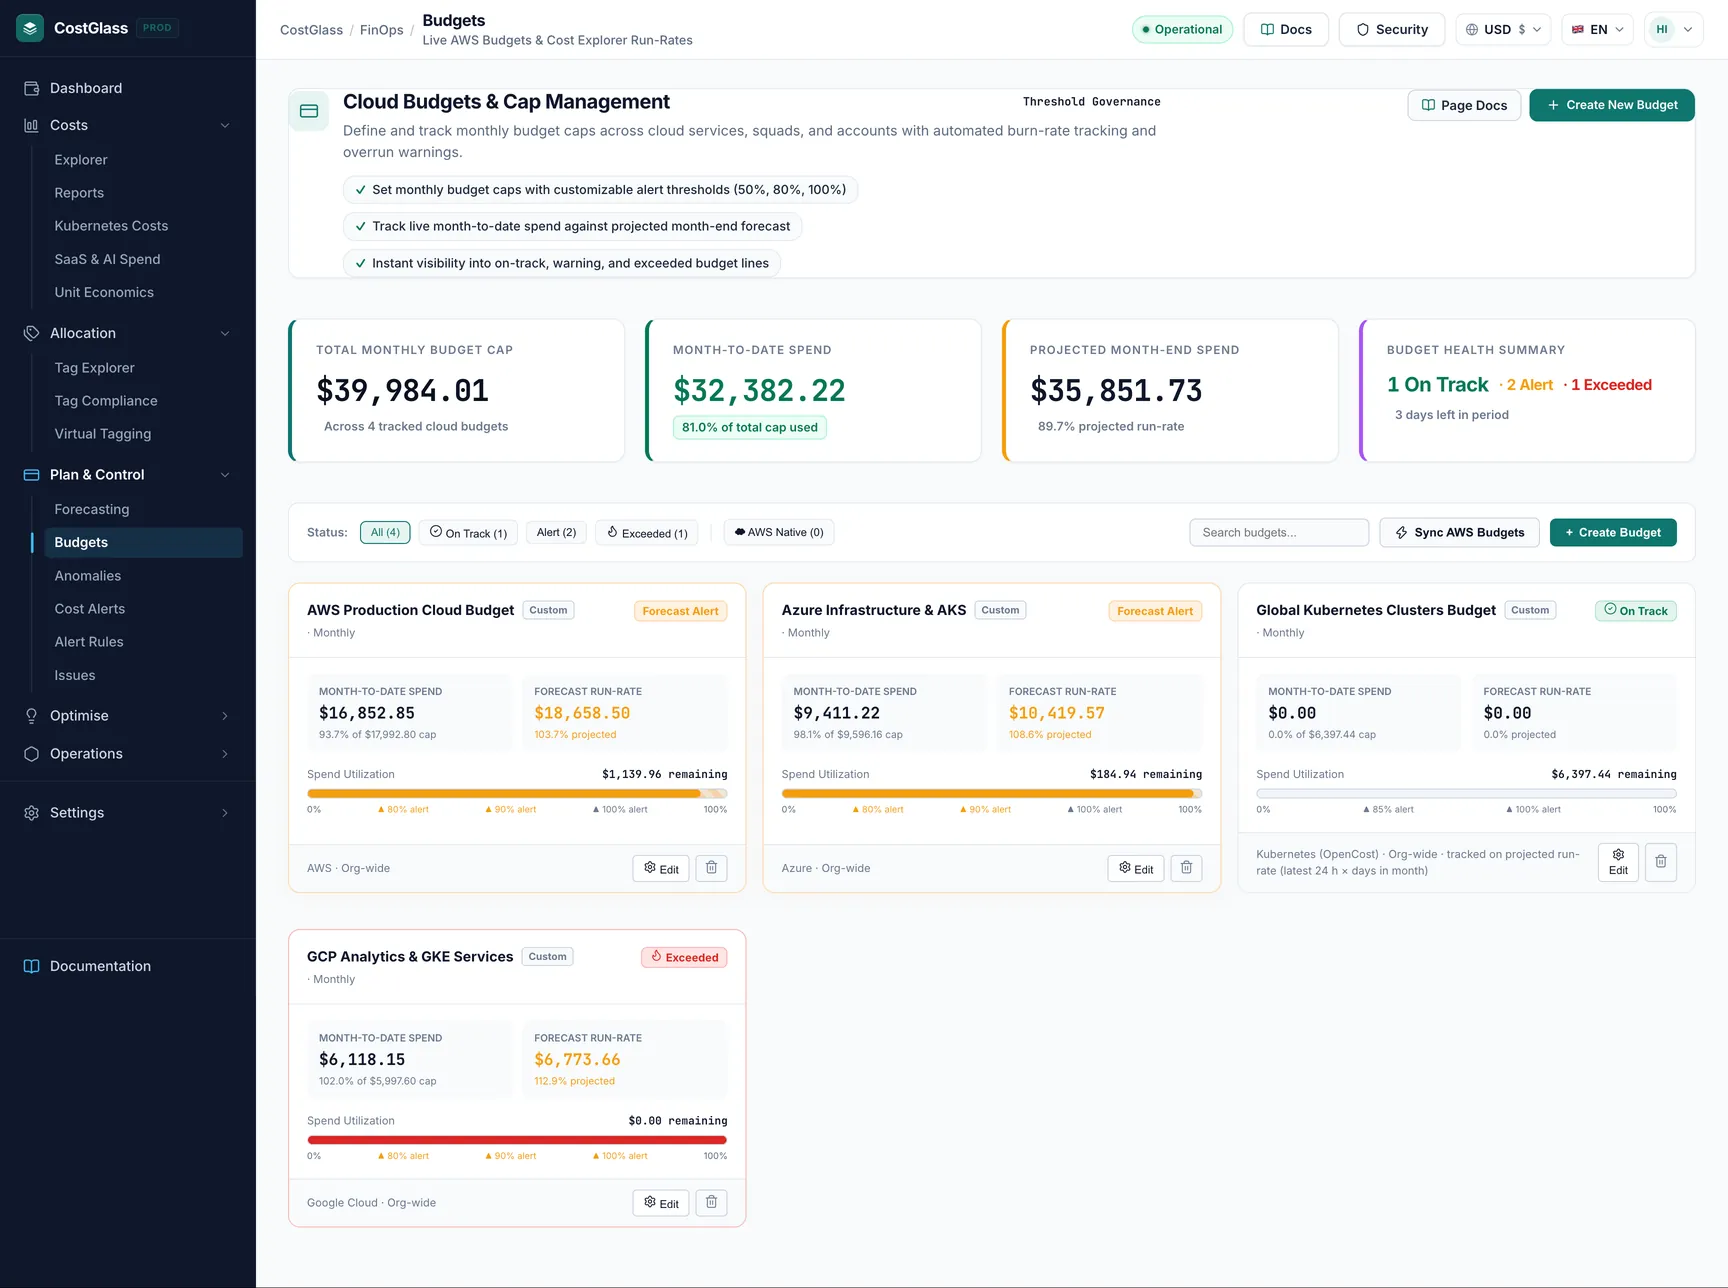
Savings
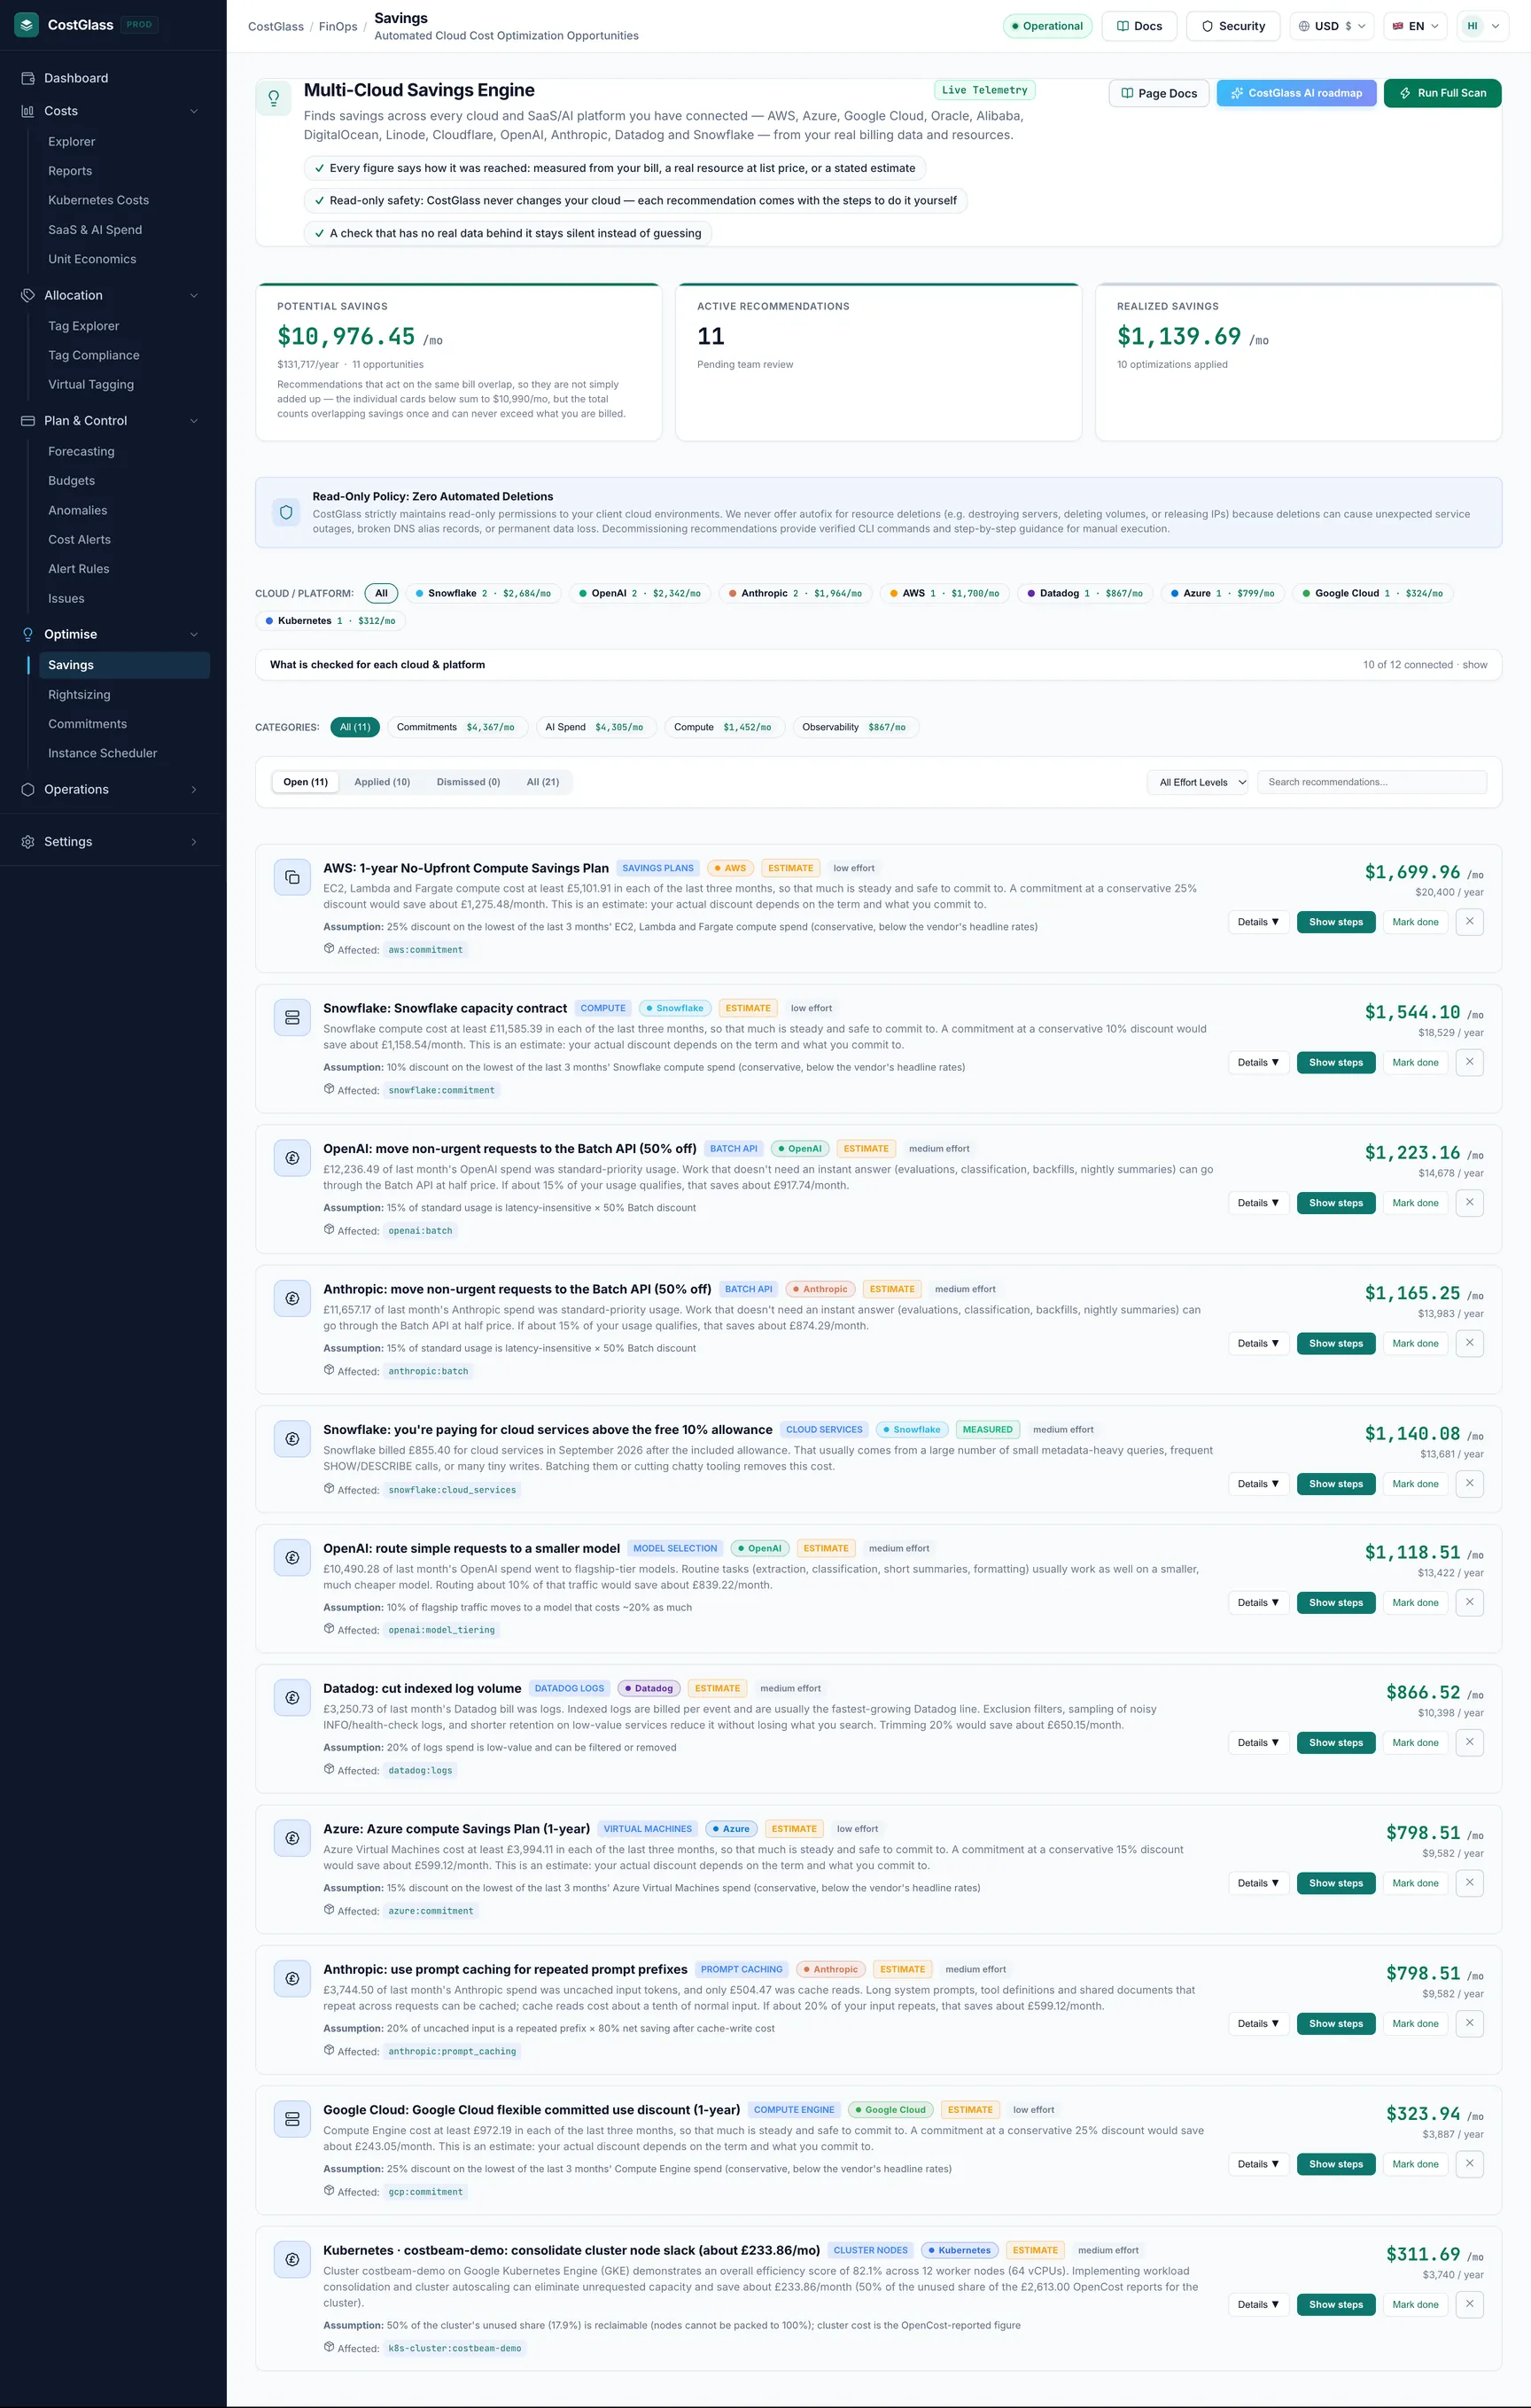
Savings open this page
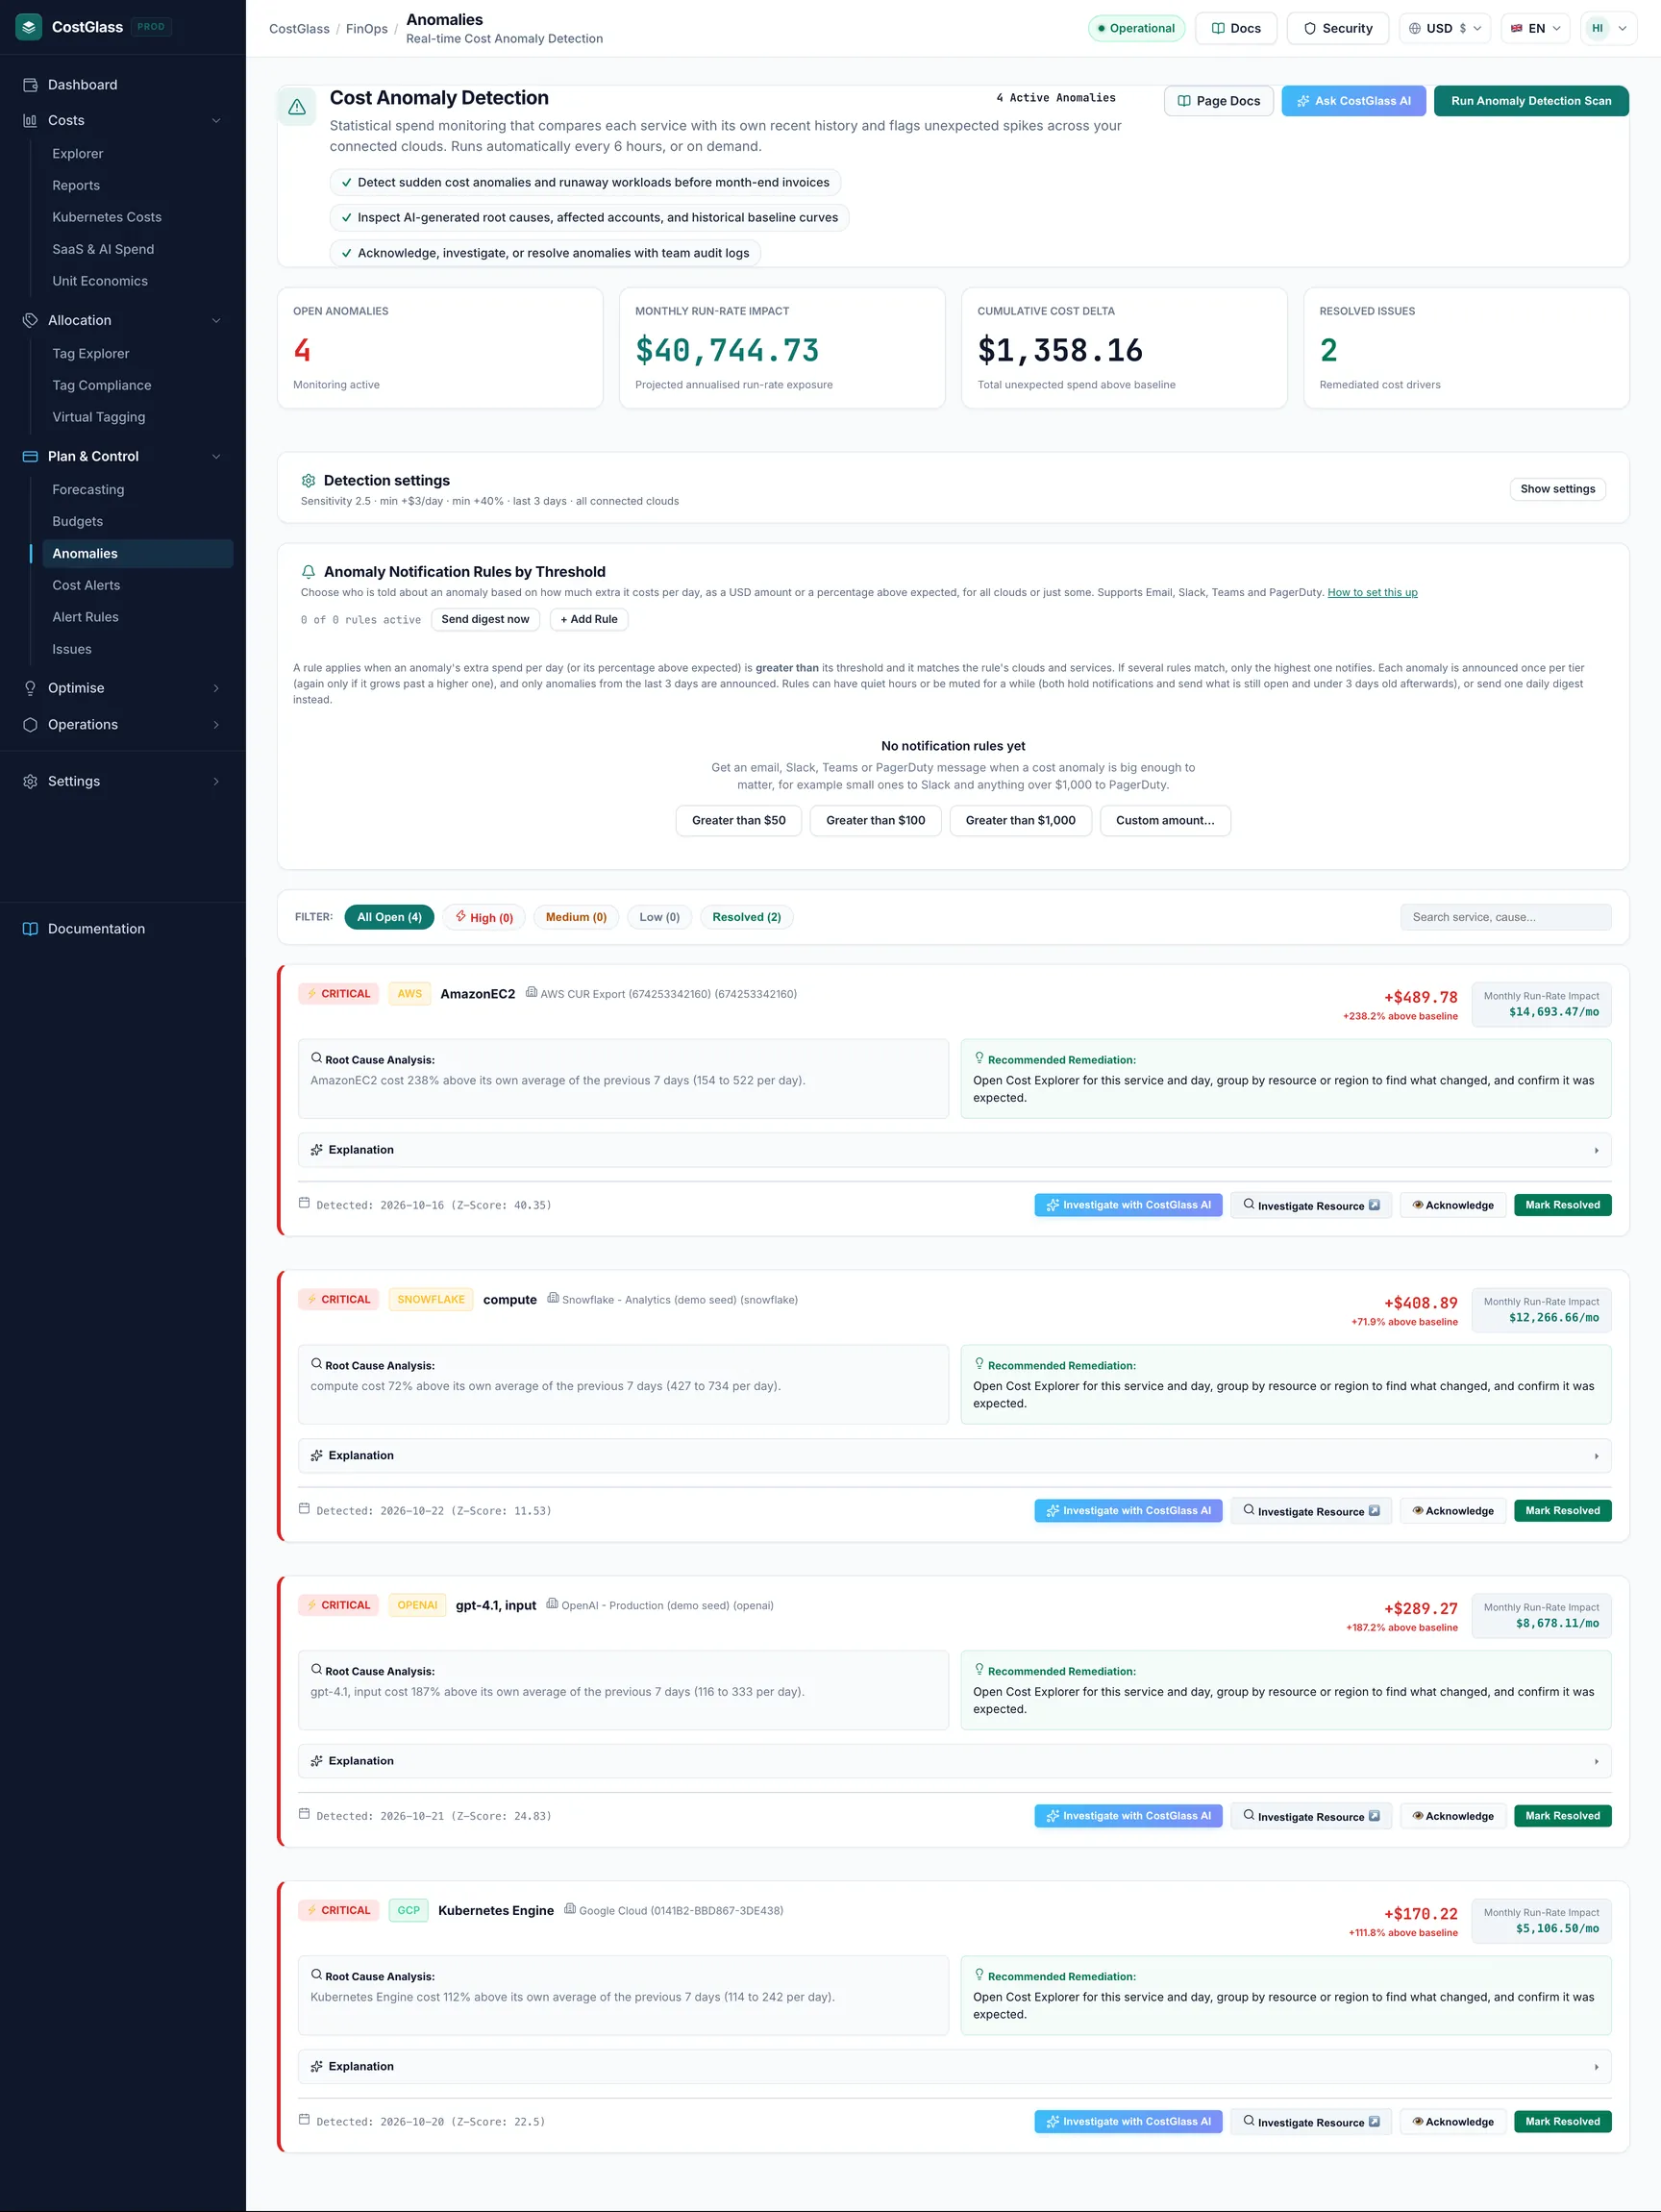
Recommendations found in your own data, each tagged with how its figure was reached (measured, list price, the cloud's own estimate, or our stated estimate). The headline total counts overlapping recommendations once, so it can never exceed your bill.
What to expect: CostGlass never changes your cloud for you here: Show steps lists what to do in your cloud console, and you mark it done afterwards. Run Full Scan refreshes the list.
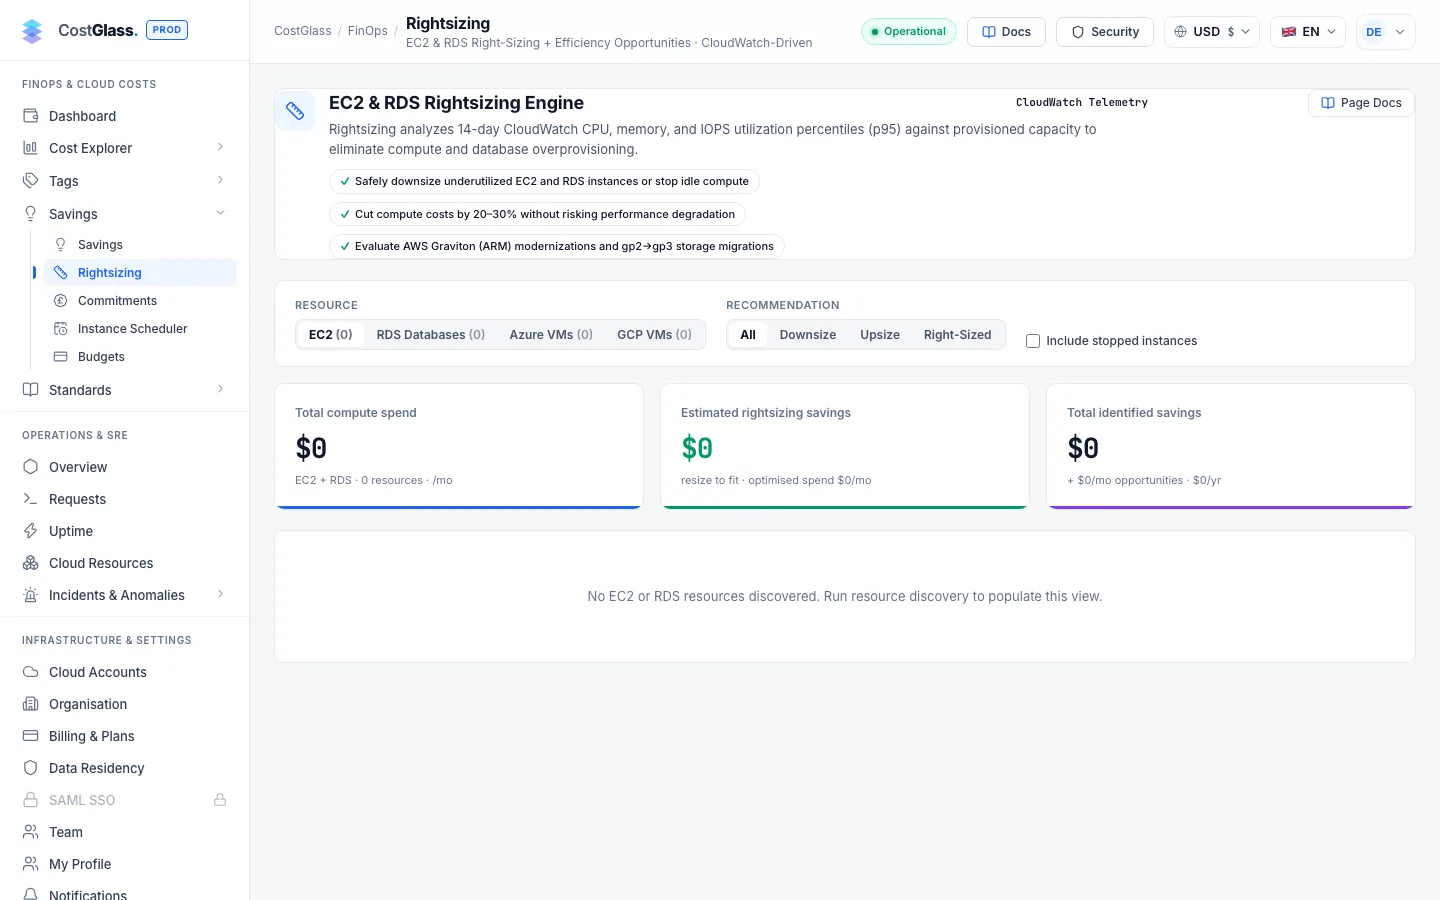
Rightsizing open this page
Instances and databases that look larger than they need to be, with a suggested size and the monthly saving.
What to expect: Shows an empty state until compute and database resources have been discovered in a connected account.
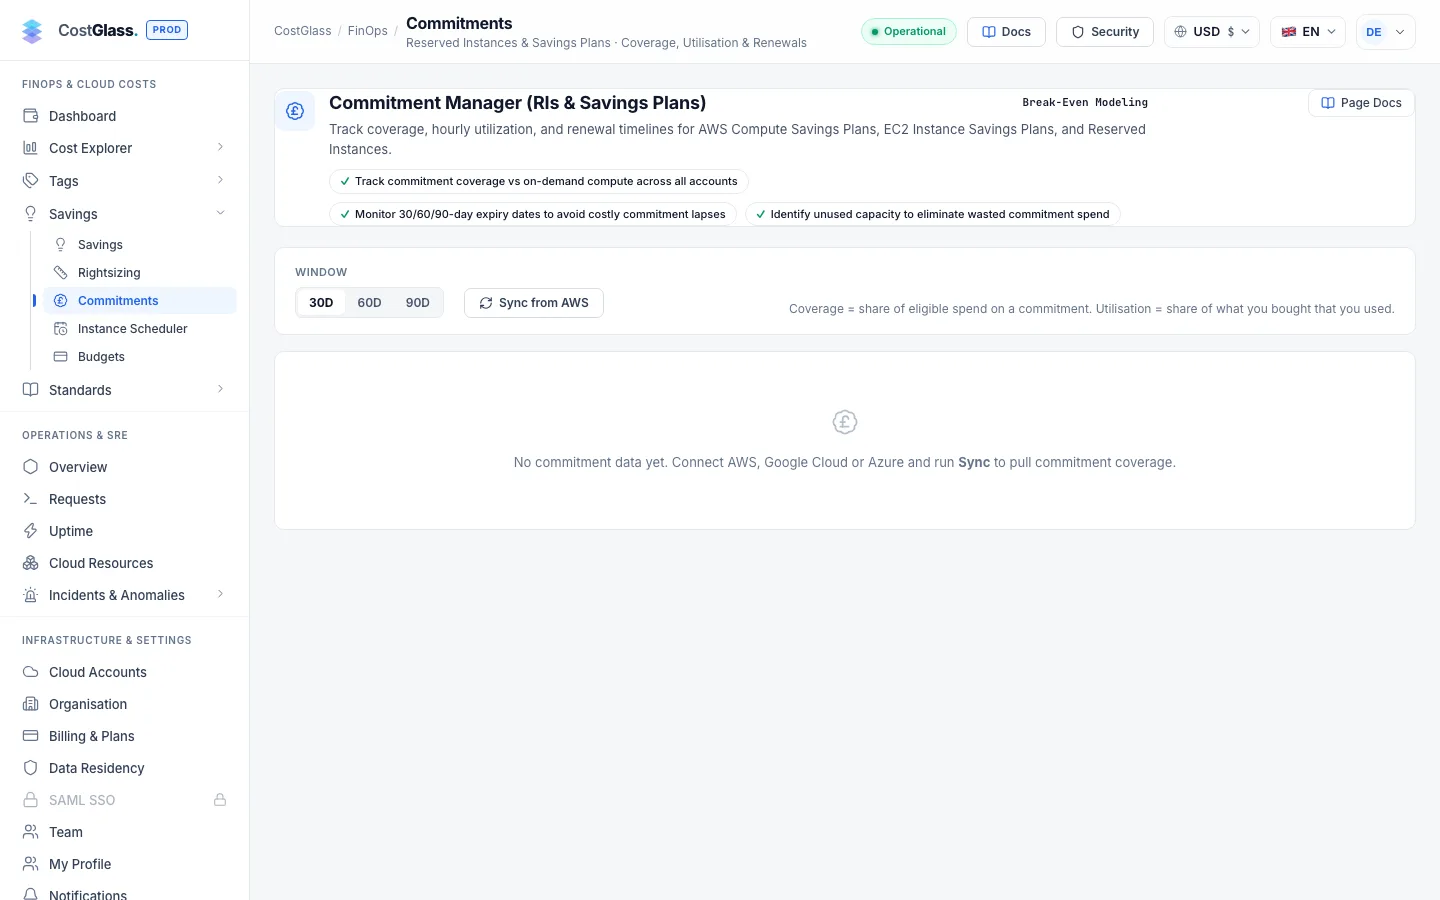
Commitments open this page
How much of your eligible spend is covered by Reserved Instances, Savings Plans, and CUDs across all clouds, how well they are used, what is about to expire and ROI purchase simulator recommendations.
What to expect: Read-only: CostGlass never buys a commitment. Empty until cloud accounts have synced.
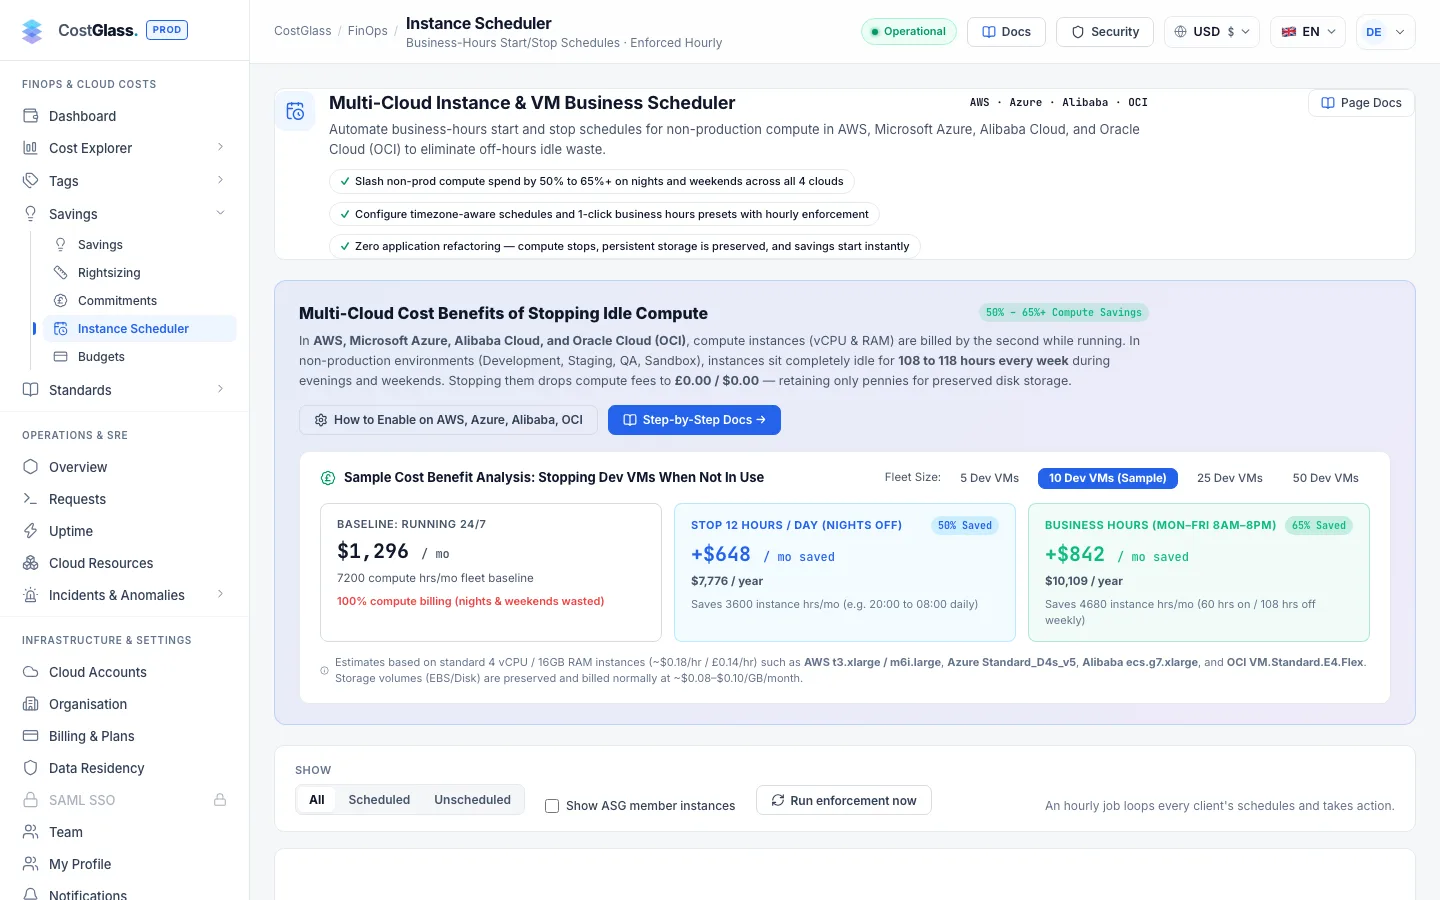
Instance Scheduler open this page
Business-hours start and stop schedules for non-production machines, with a savings preview before you turn anything on.
What to expect: This is the one feature that can change your cloud, and only for the machines you schedule, using permissions you granted when you ticked it.
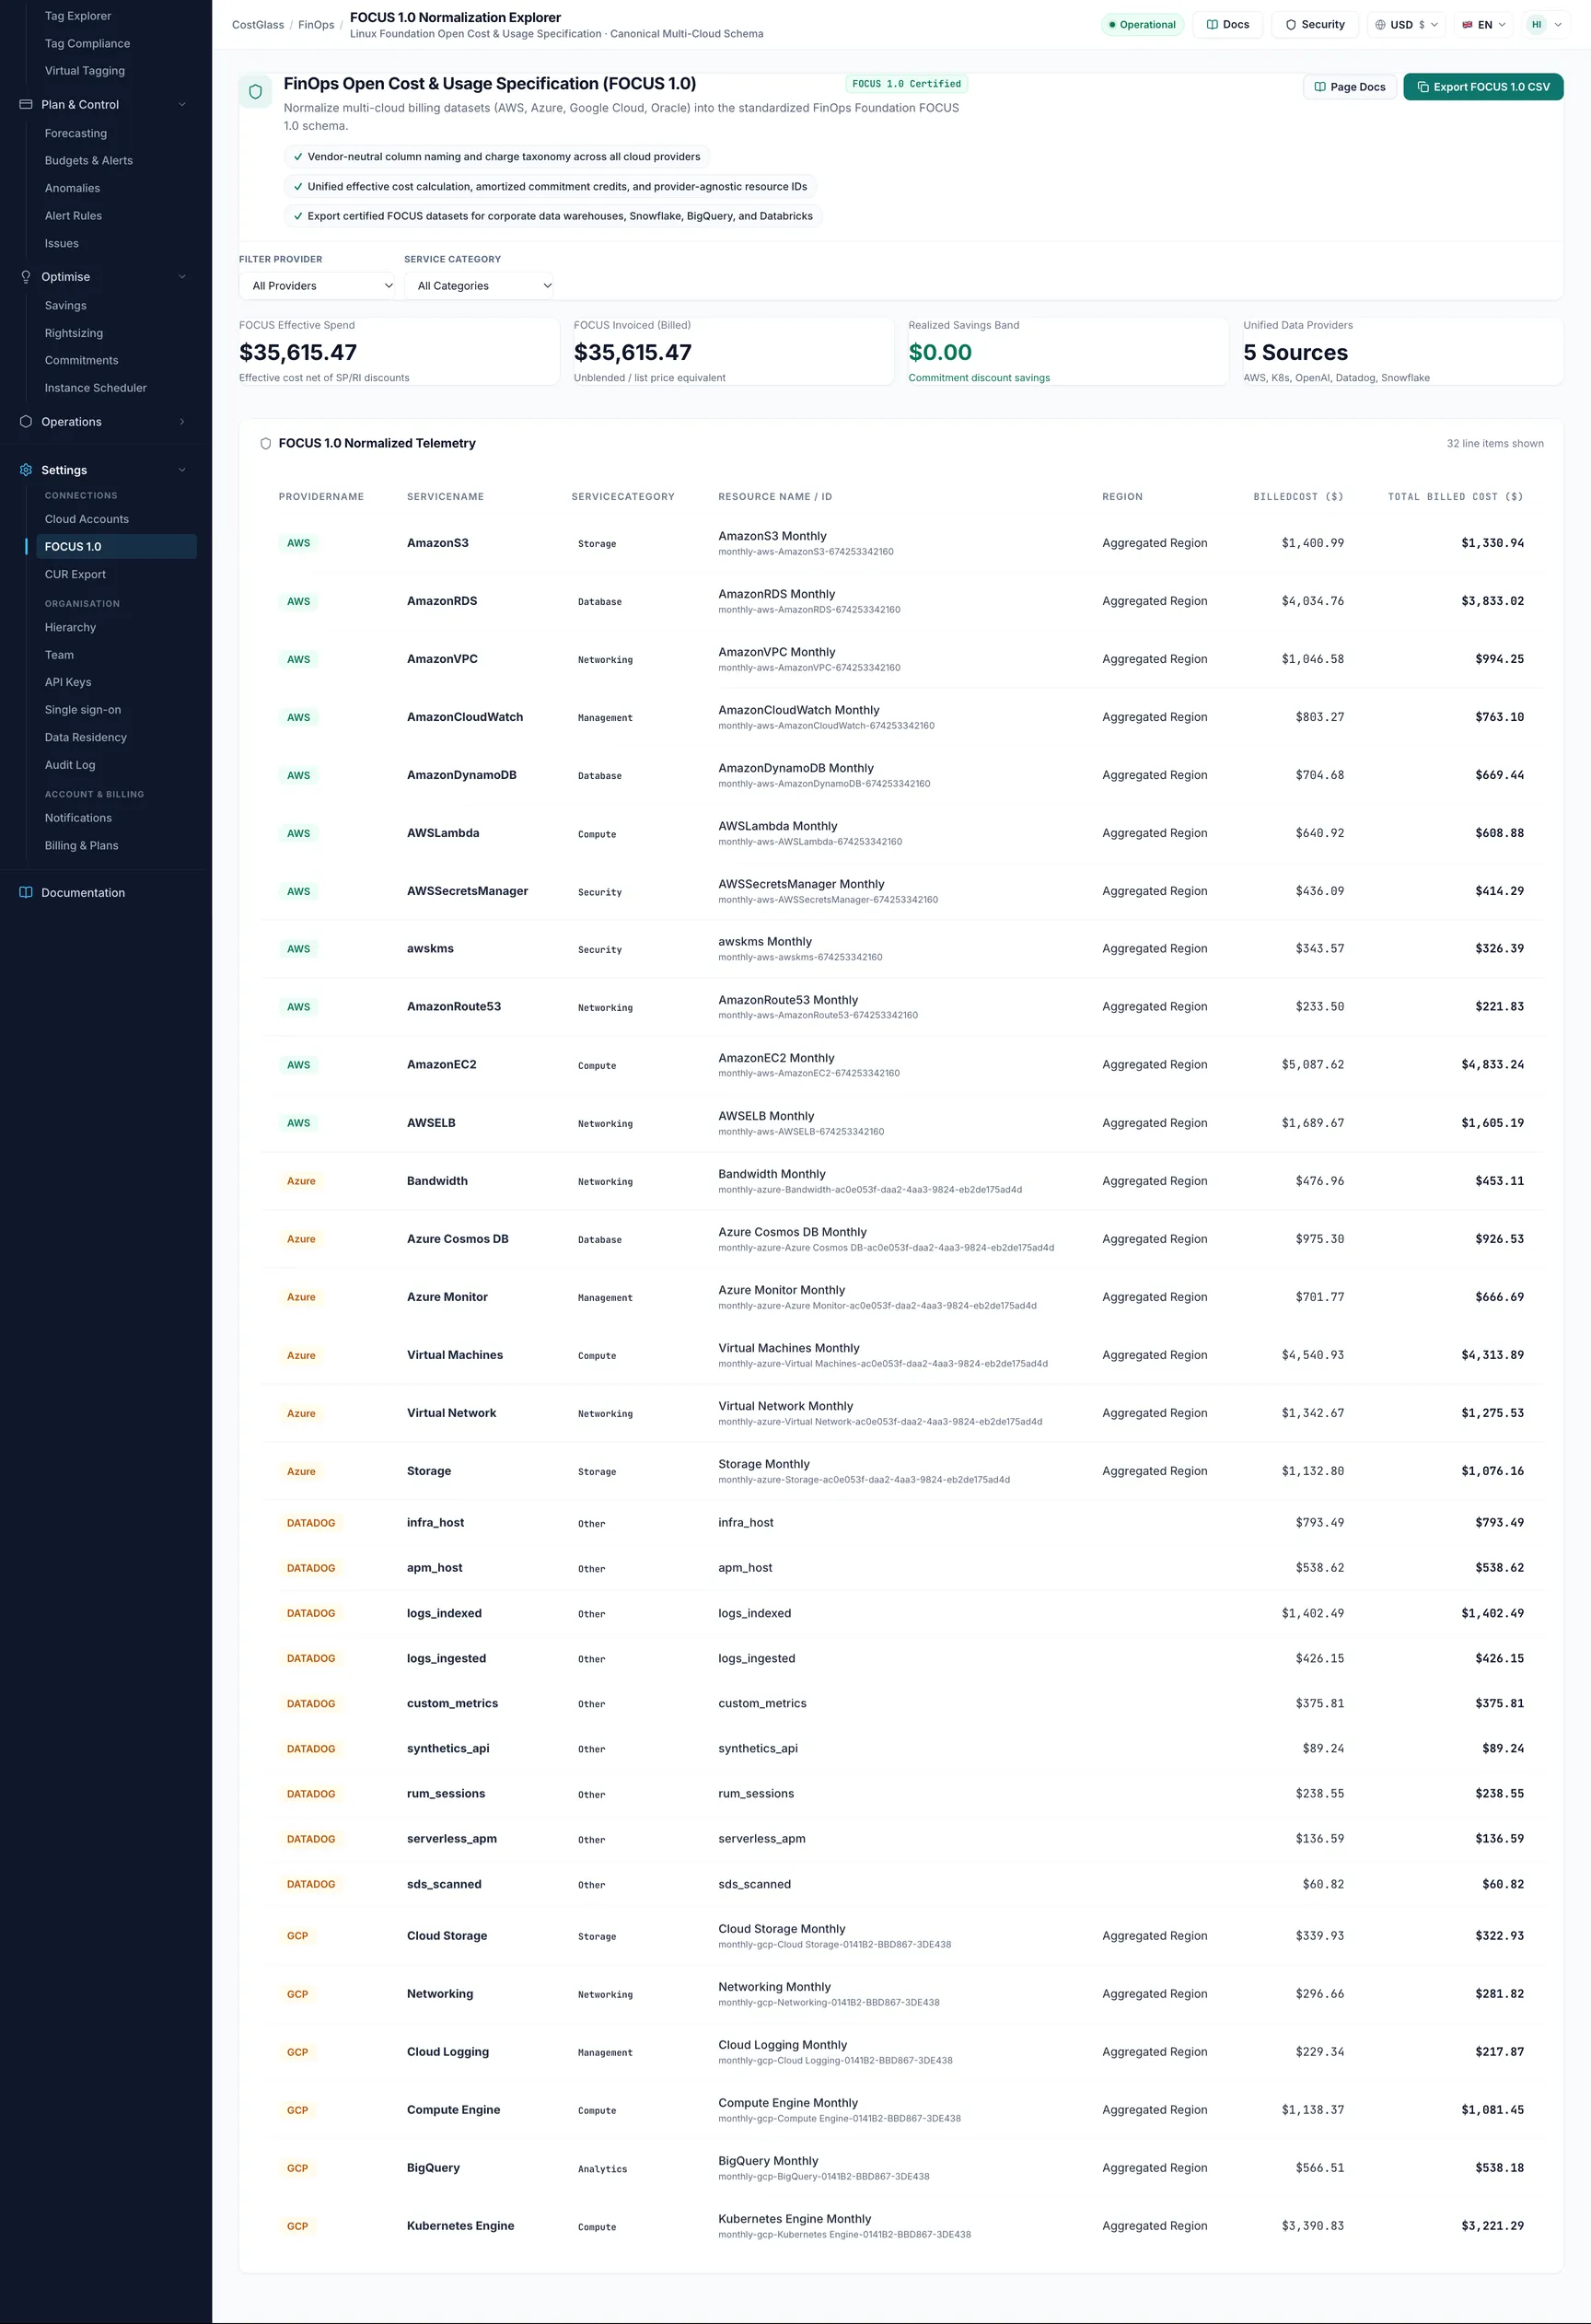
Standards
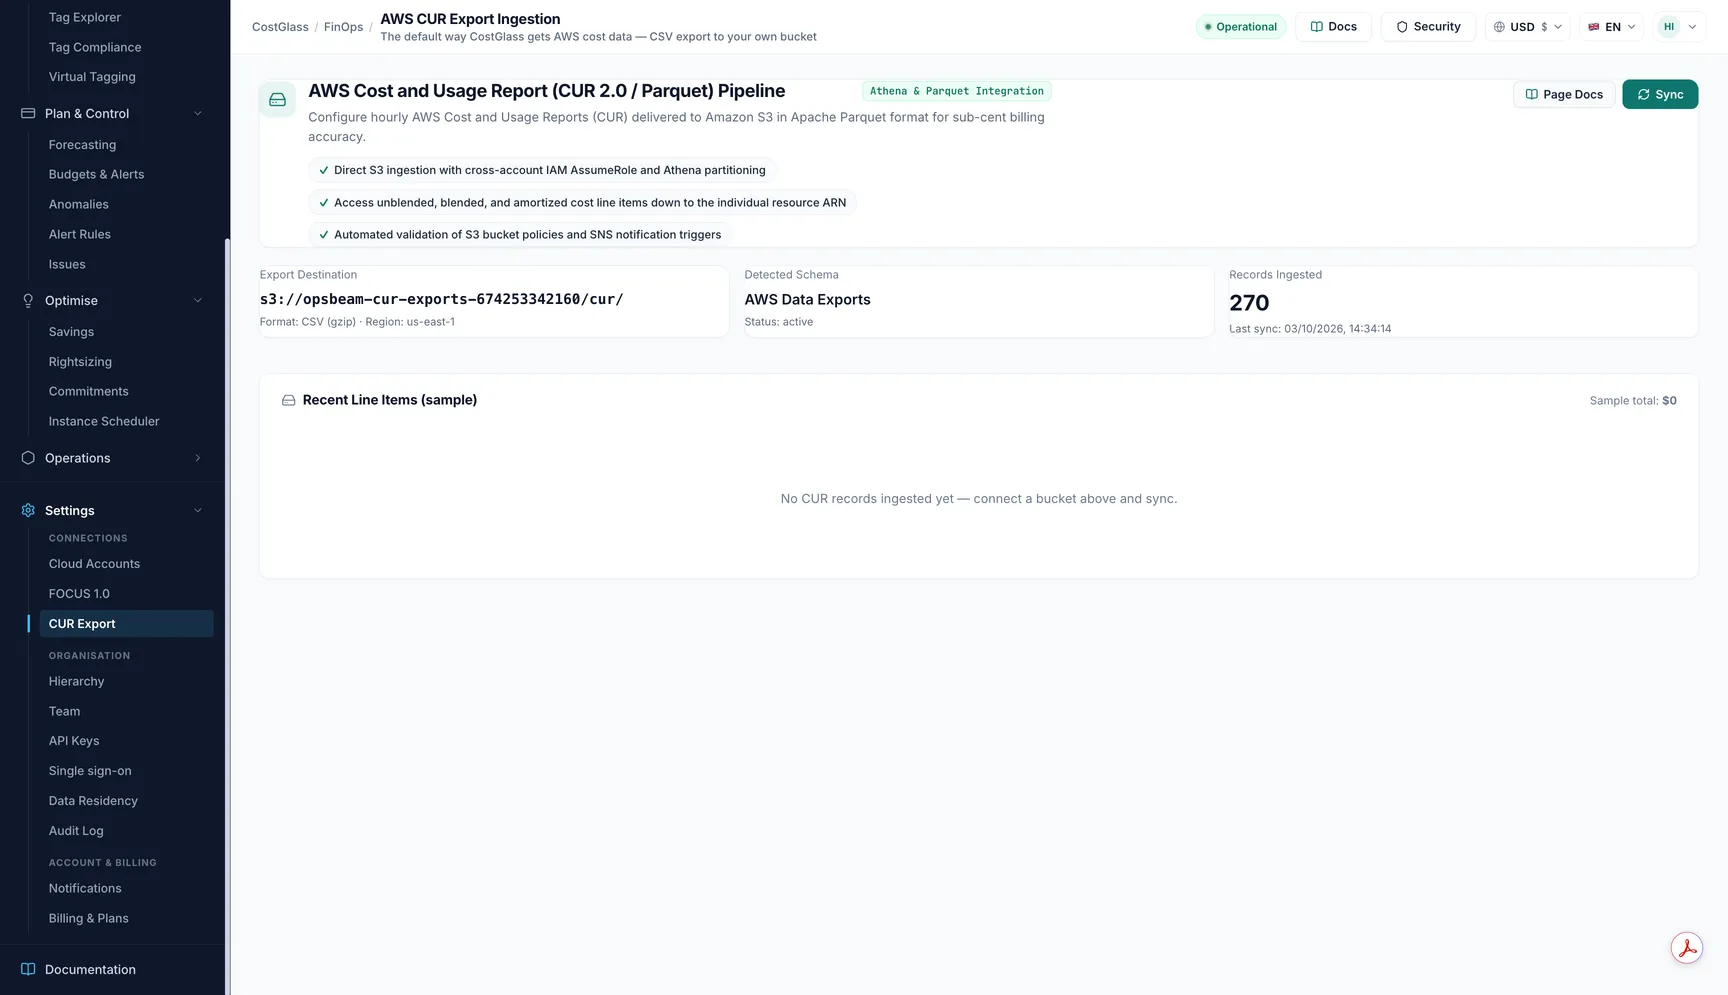
Operations
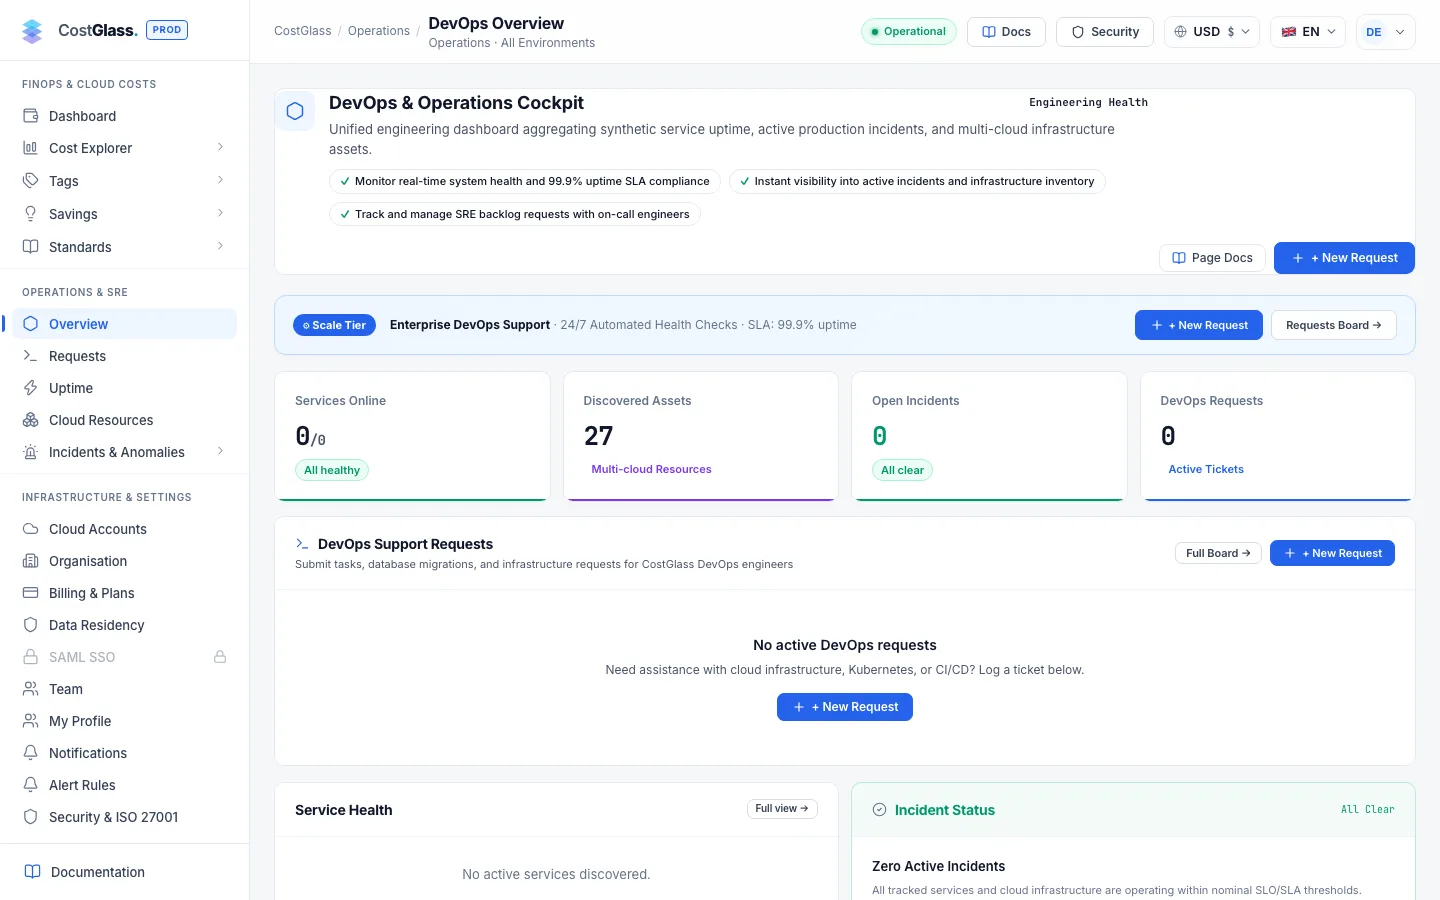
Overview open this page
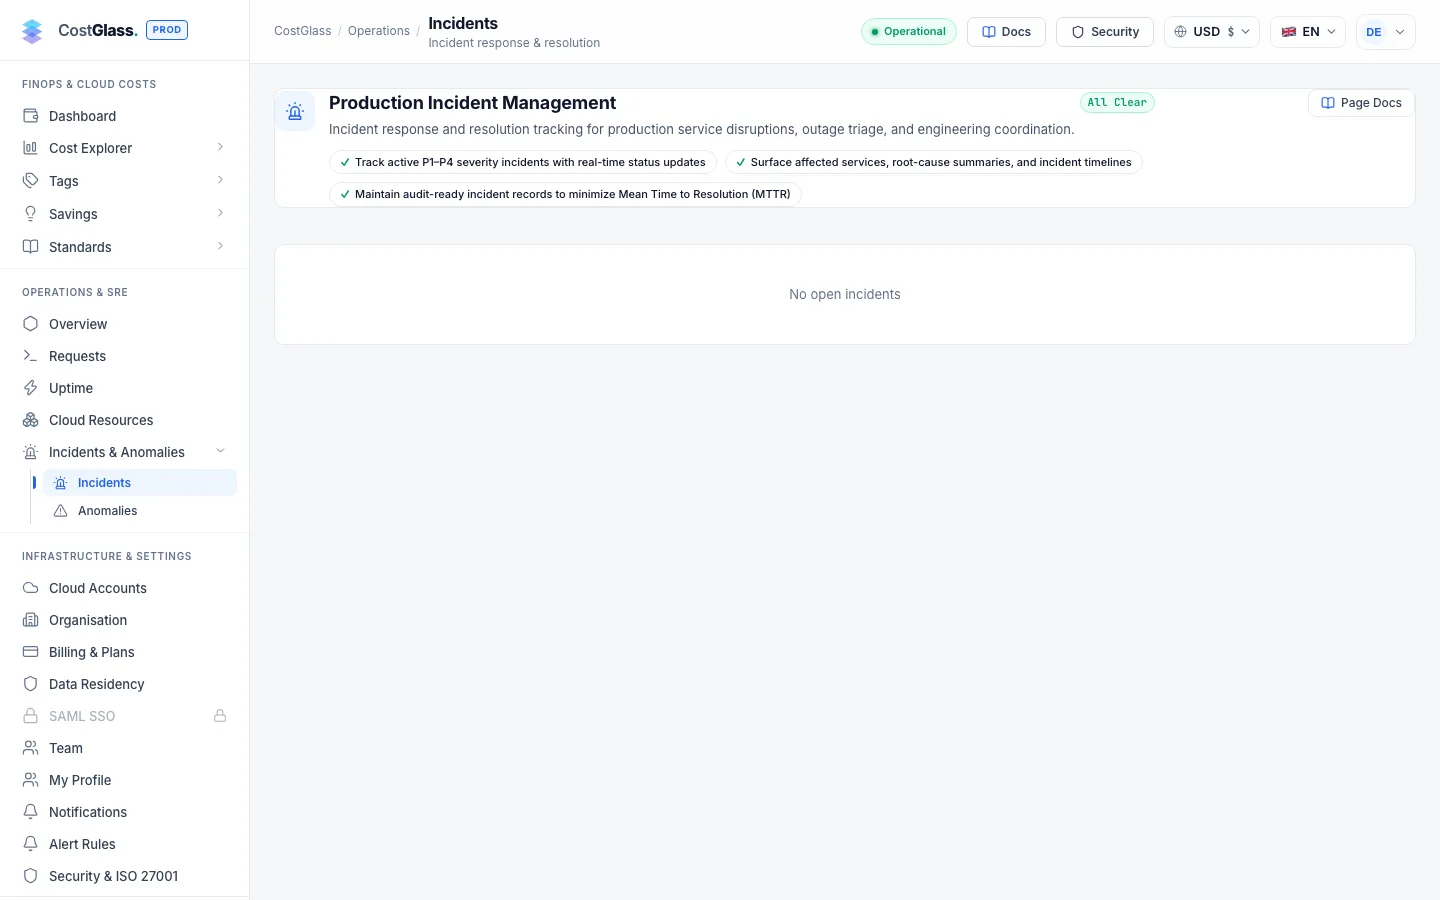
The operations cockpit: service health, discovered cloud resources, open incidents and open requests to your engineers.
What to expect: Counts reflect only what you have connected or registered.
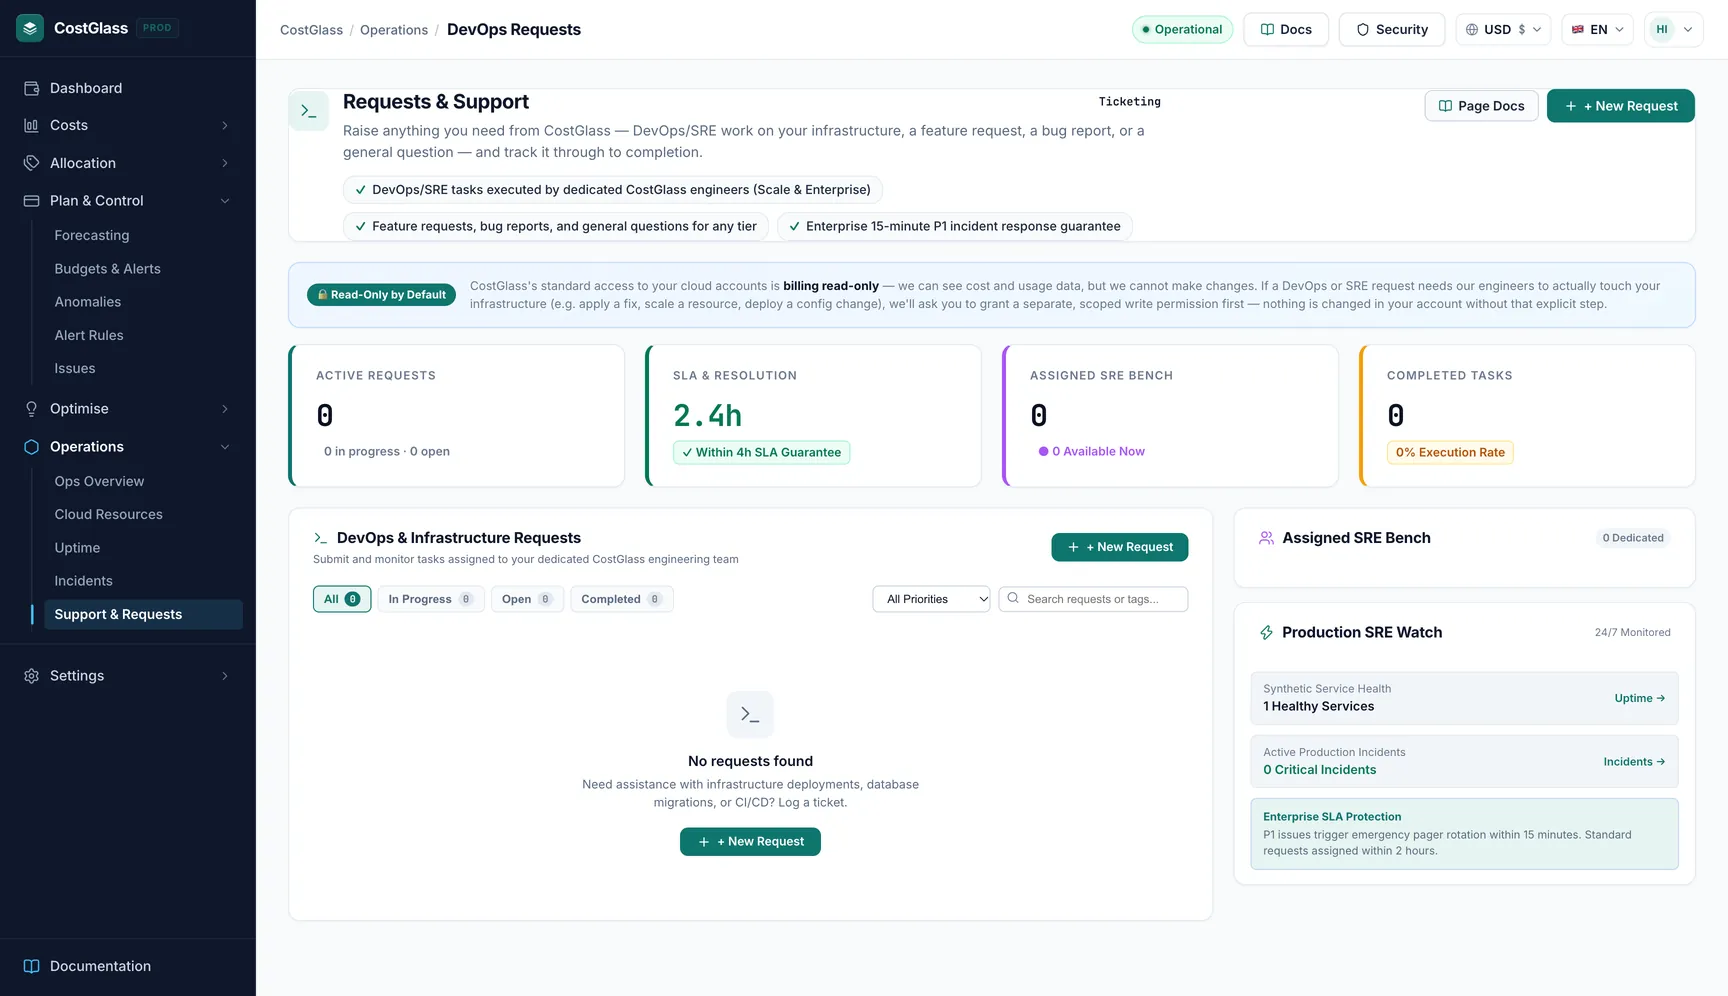
Requests open this page
Ask the engineers behind your plan for help (a cost investigation, a rightsizing change, an infrastructure task) and follow its progress.
What to expect: Available on the Growth plan and above.
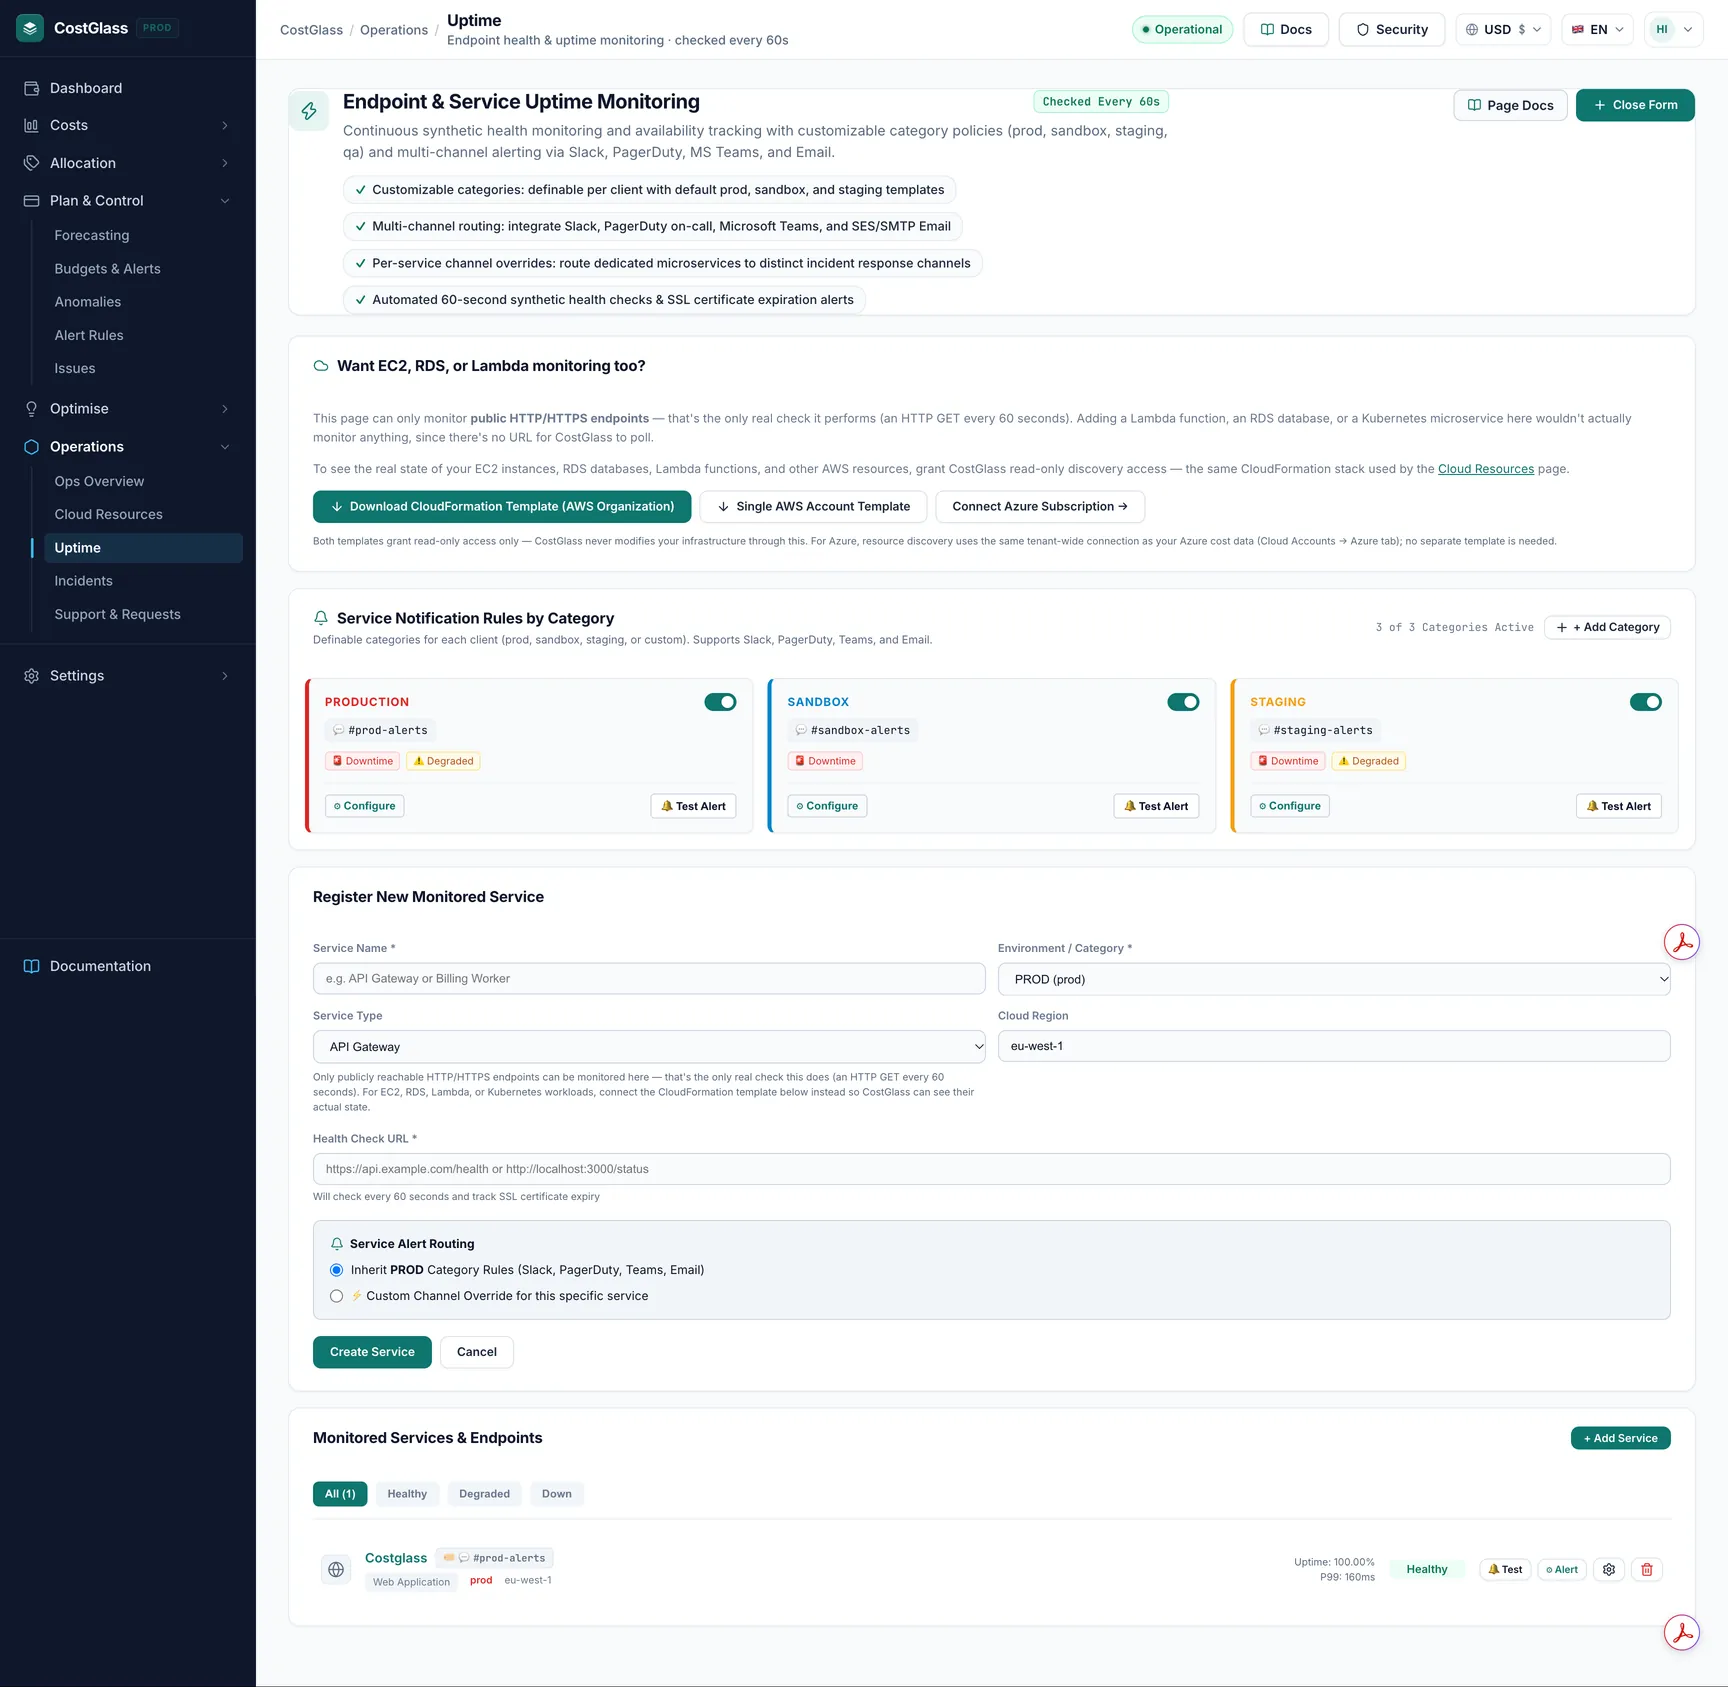
Uptime open this page
Endpoint checks with response time, status history and SSL expiry, plus alert rules by category such as production, staging and sandbox.
What to expect: Add the URLs to monitor; alerts go to the channels you choose.
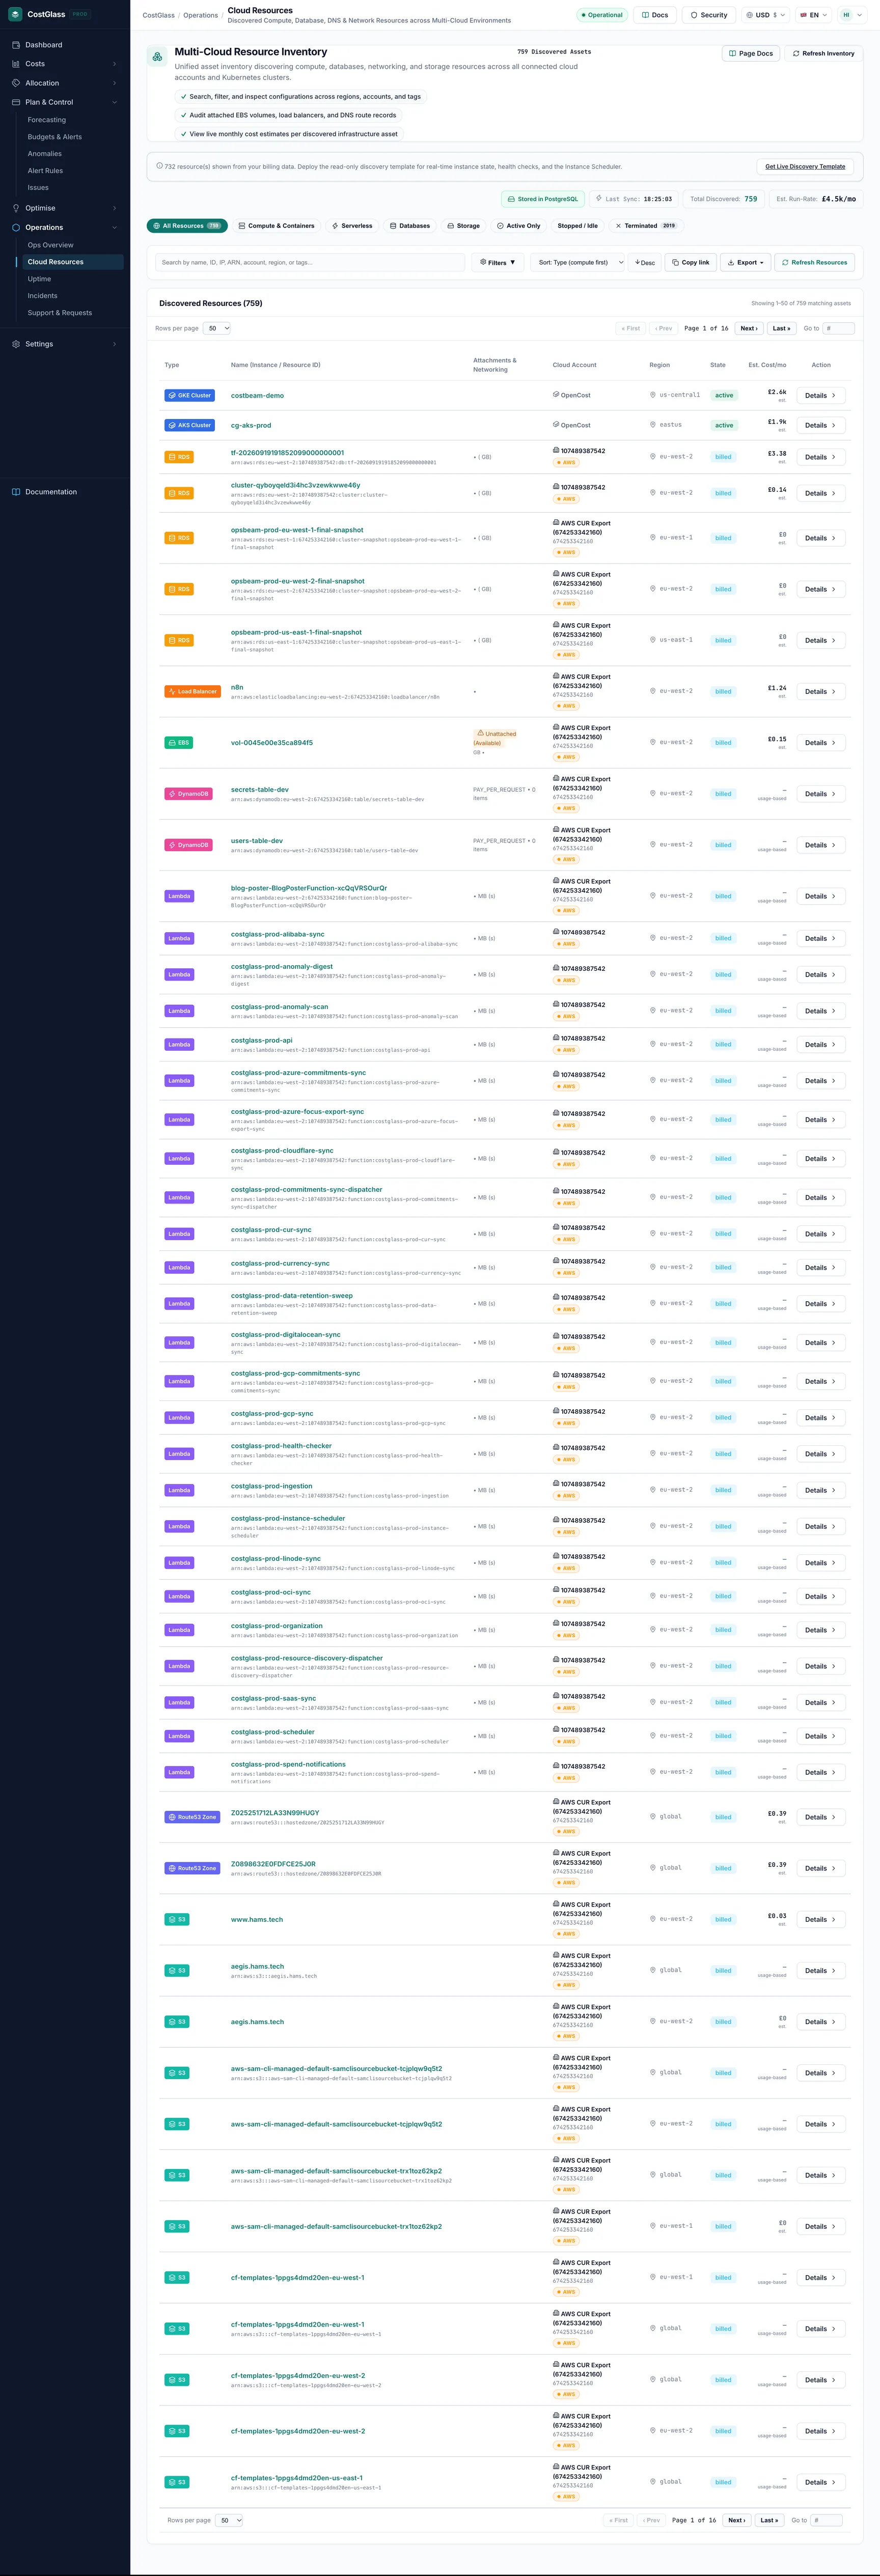
Cloud Resources open this page
One inventory of everything found across your clouds and clusters: virtual machines, databases, storage, networking and, under Containers, your Kubernetes workloads and ECS services.
What to expect: Filters, search and sort are saved in the address bar, so you can share a filtered view. Export downloads everything matching your filters as CSV or Excel.
Settings
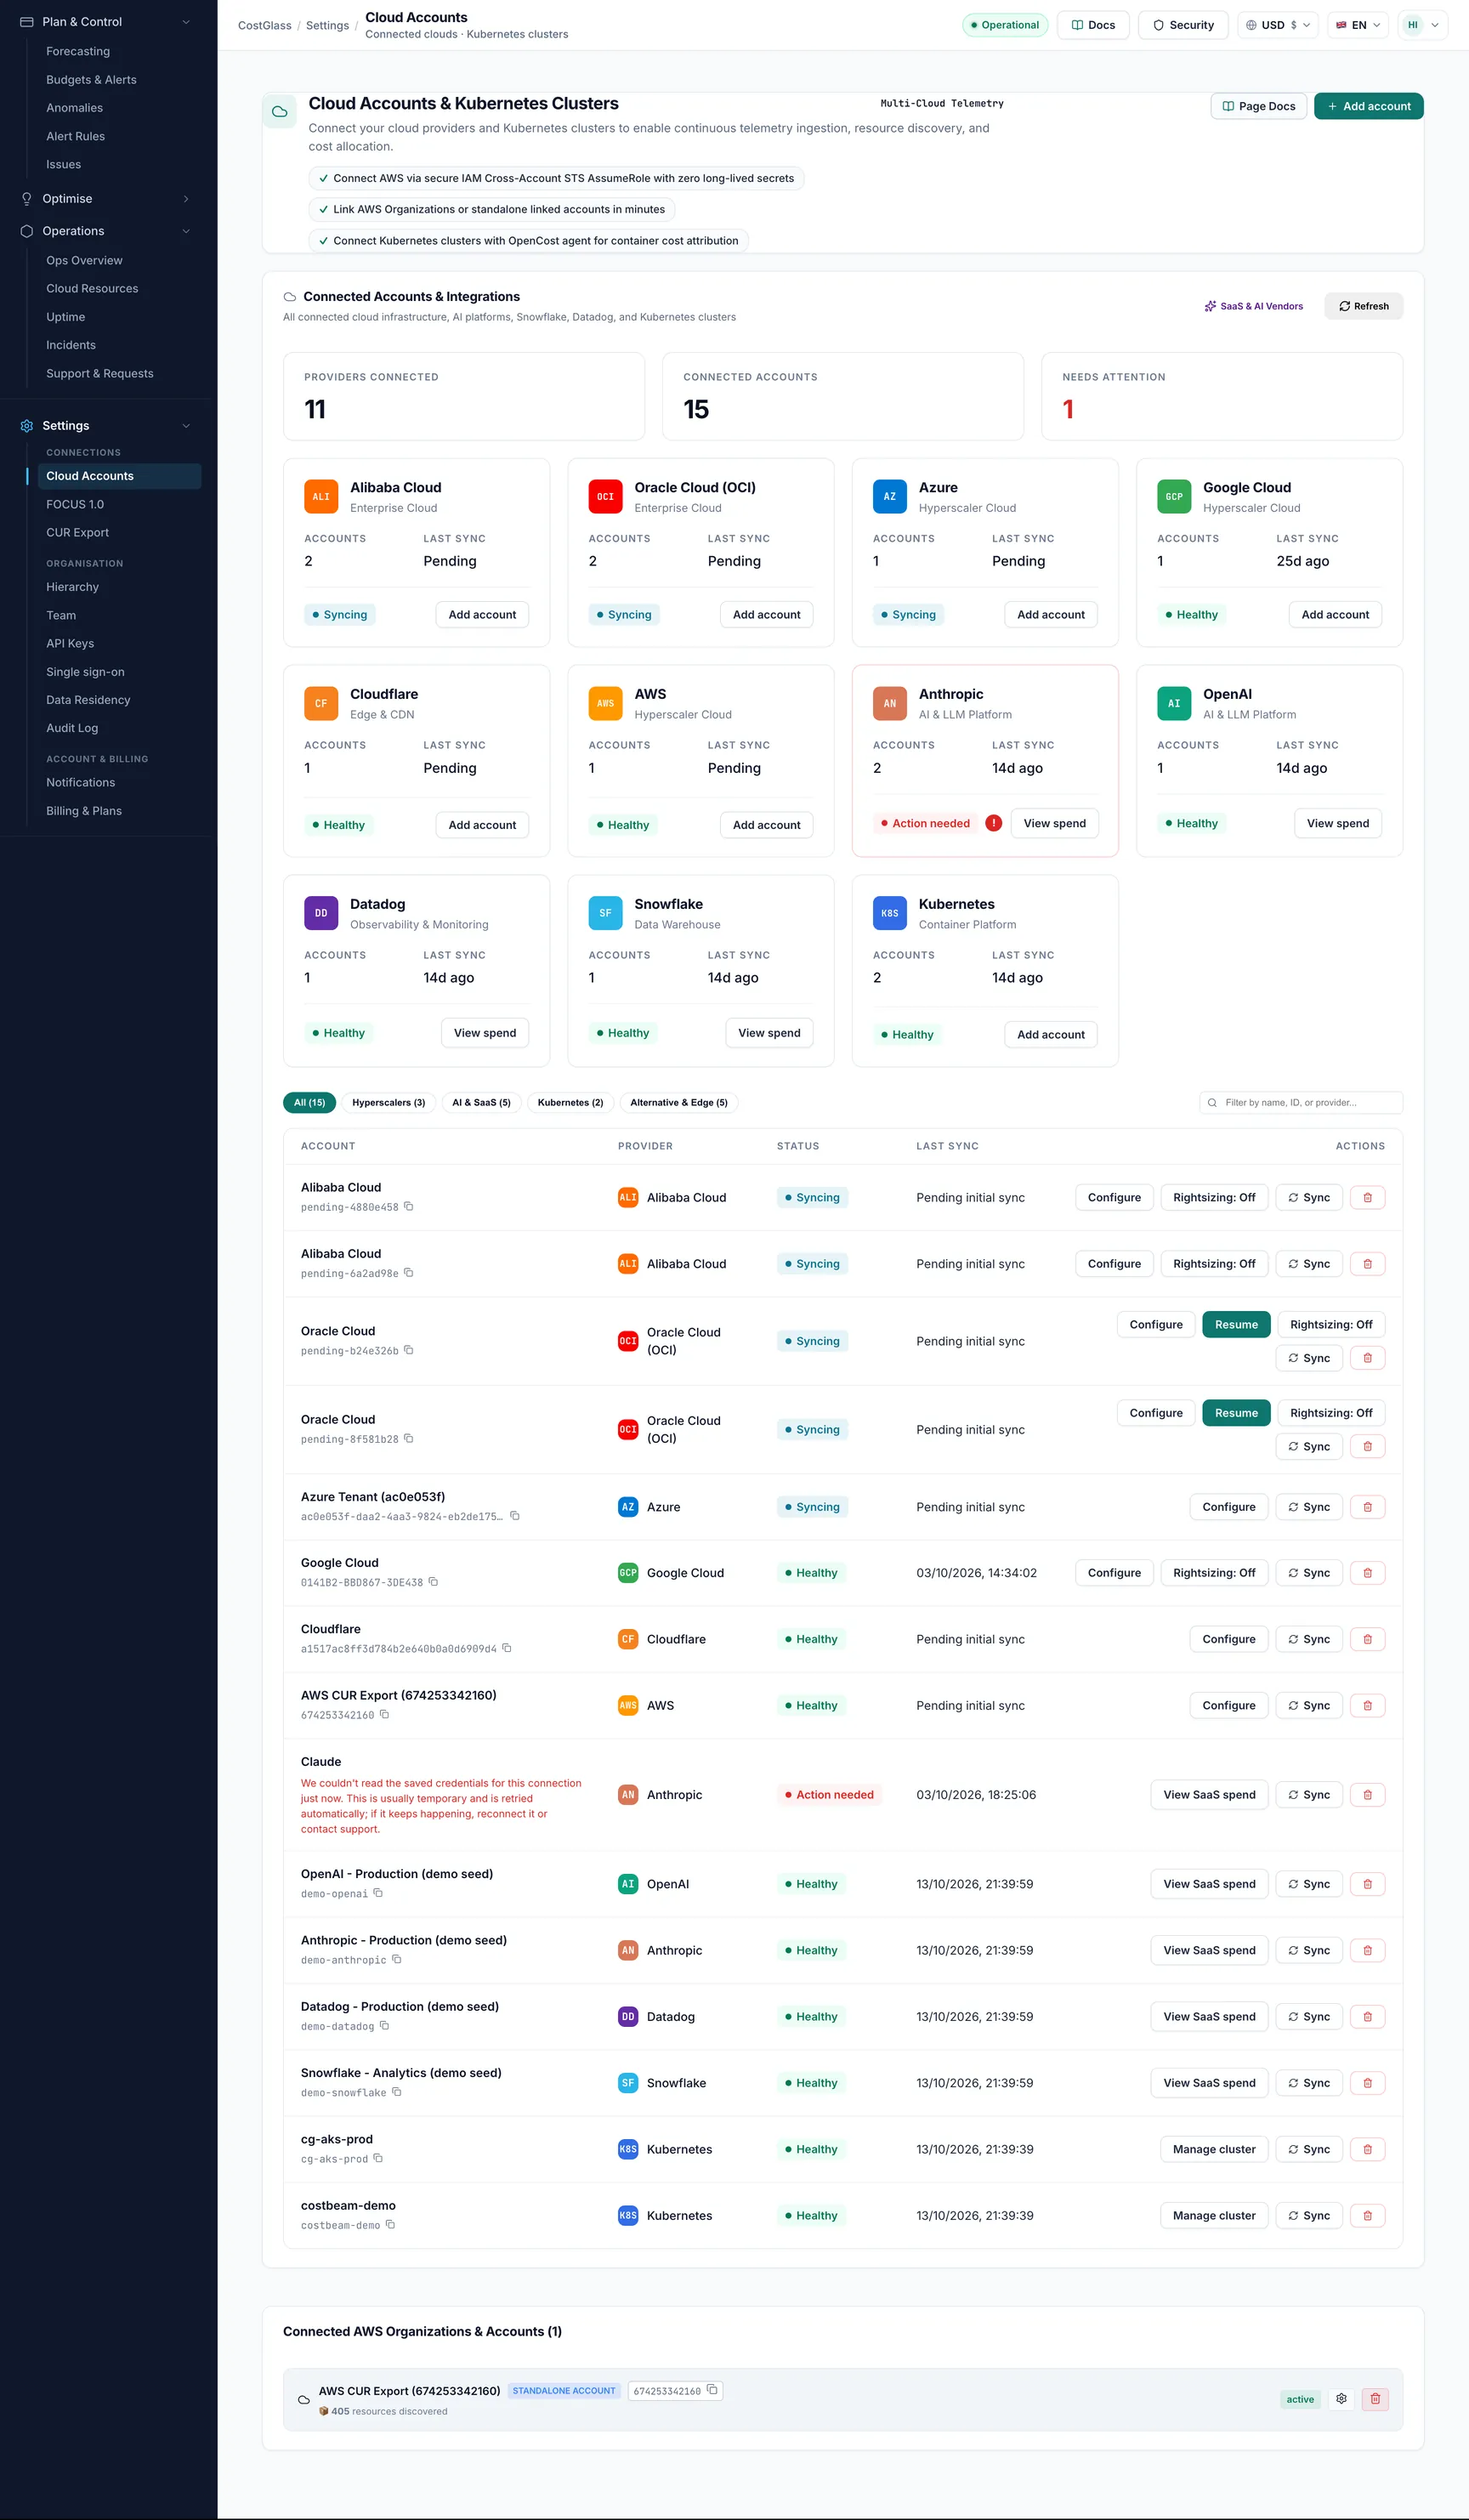
Cloud Accounts open this page
Everything you have connected, grouped by hyperscaler, AI and SaaS, Kubernetes and other clouds, with a tab for connecting each provider.
What to expect: This is where the step-by-step connection guides in this documentation take place.
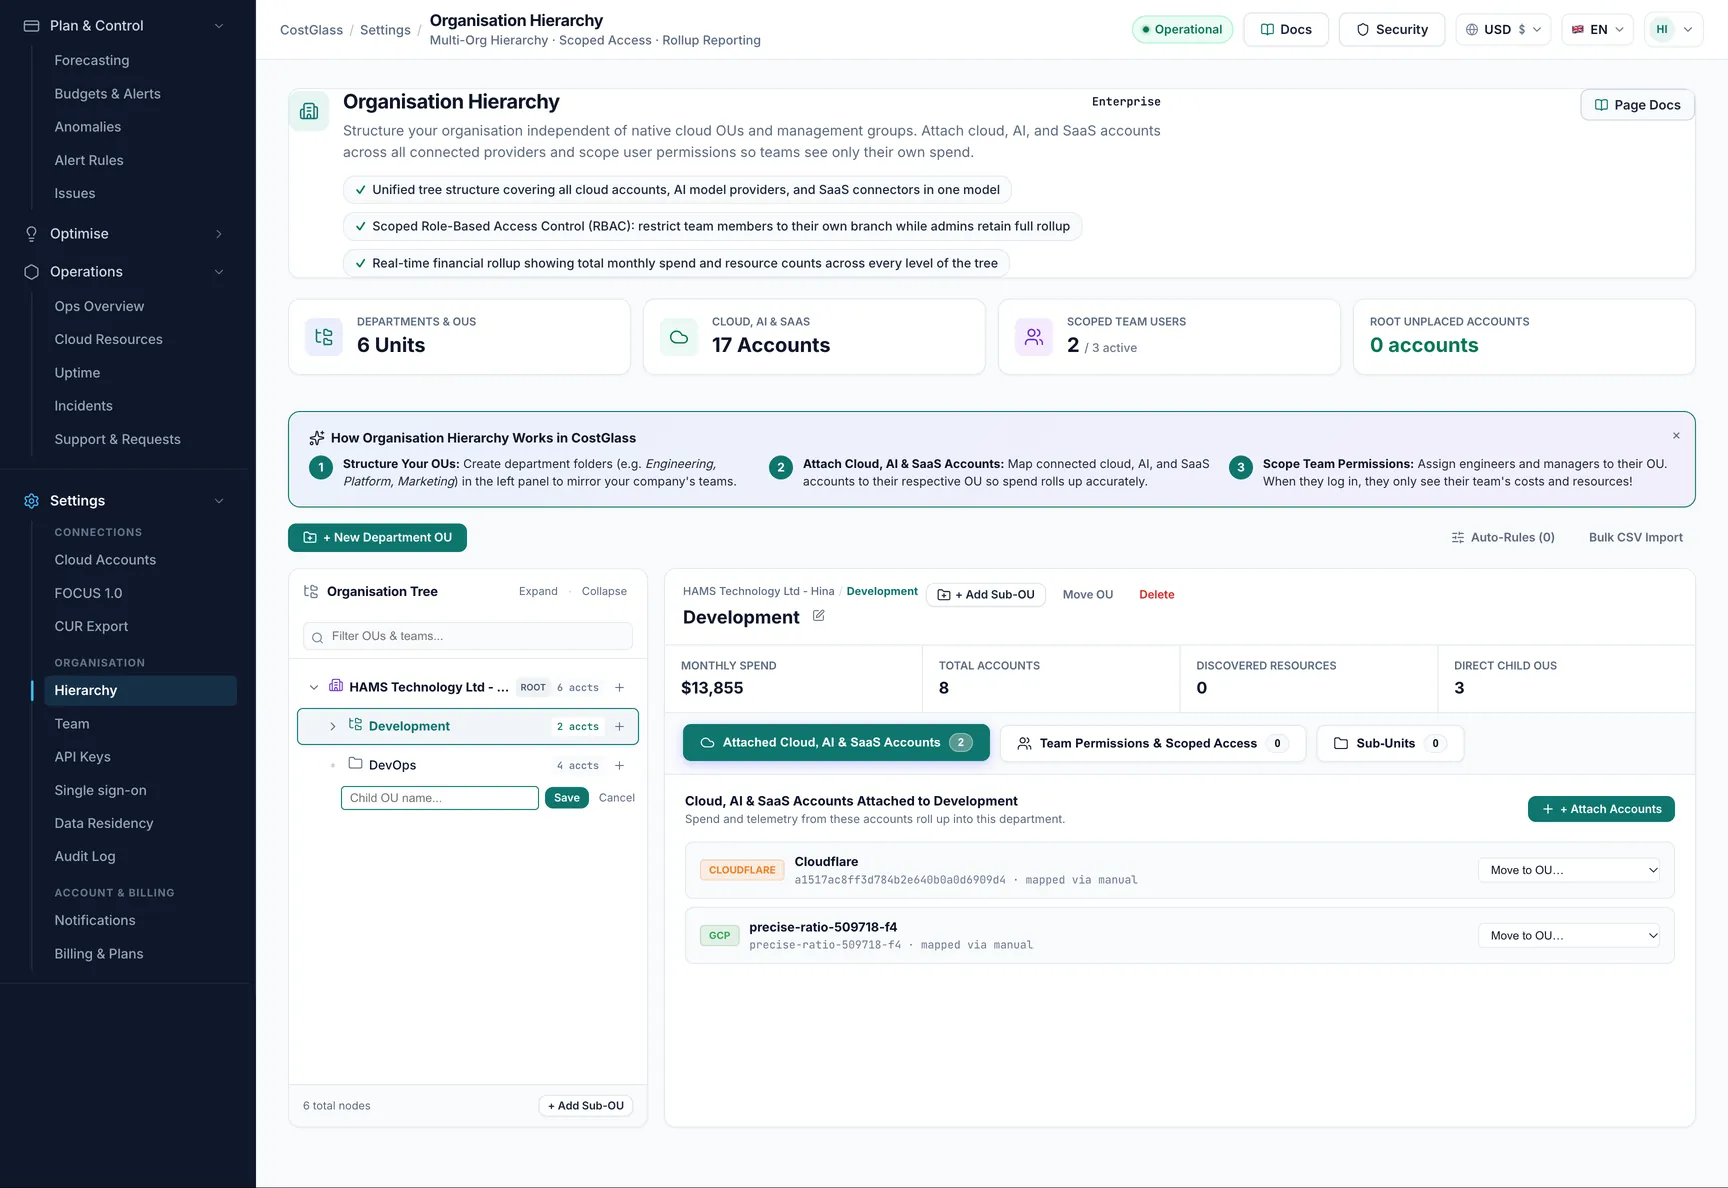
Organisation open this page
Group your accounts into a tree (business units, teams, environments) and give people access to only their part of it.
What to expect: Rollups, budgets and reports respect the part of the tree a user can see.
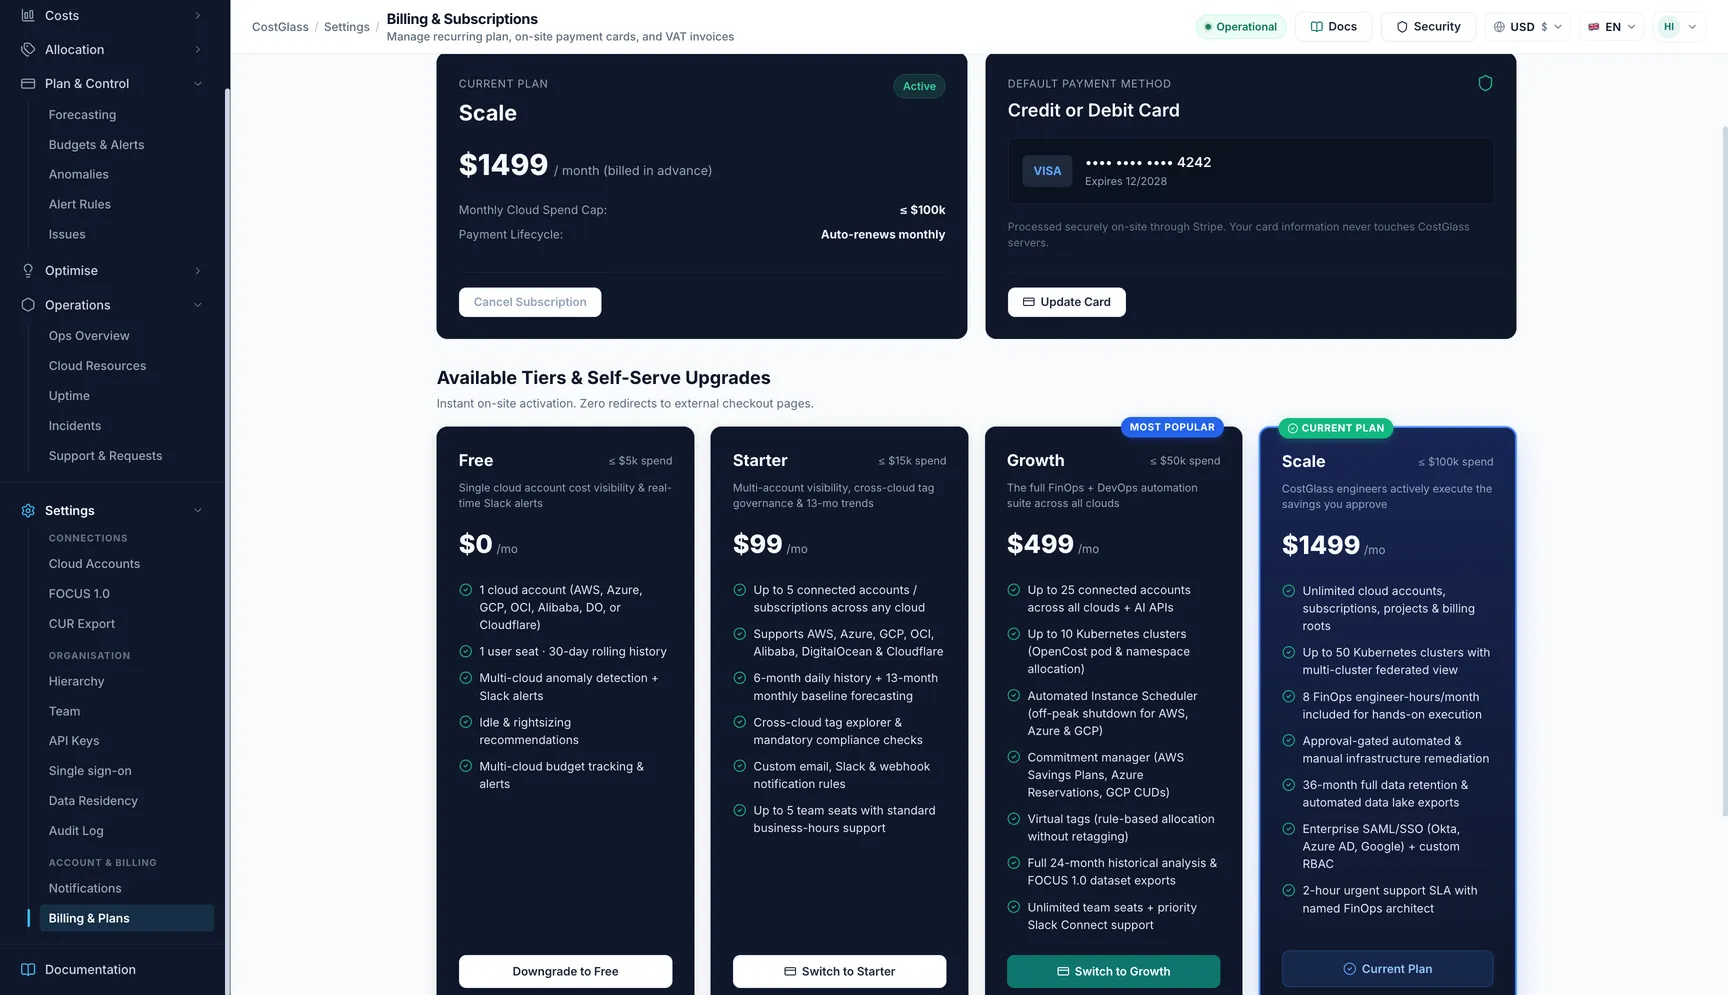
Billing & Plans open this page
Your plan, payment method, invoices and receipts, and upgrade options.
What to expect: Plan limits, such as how many cloud connections you can have, are shown here.
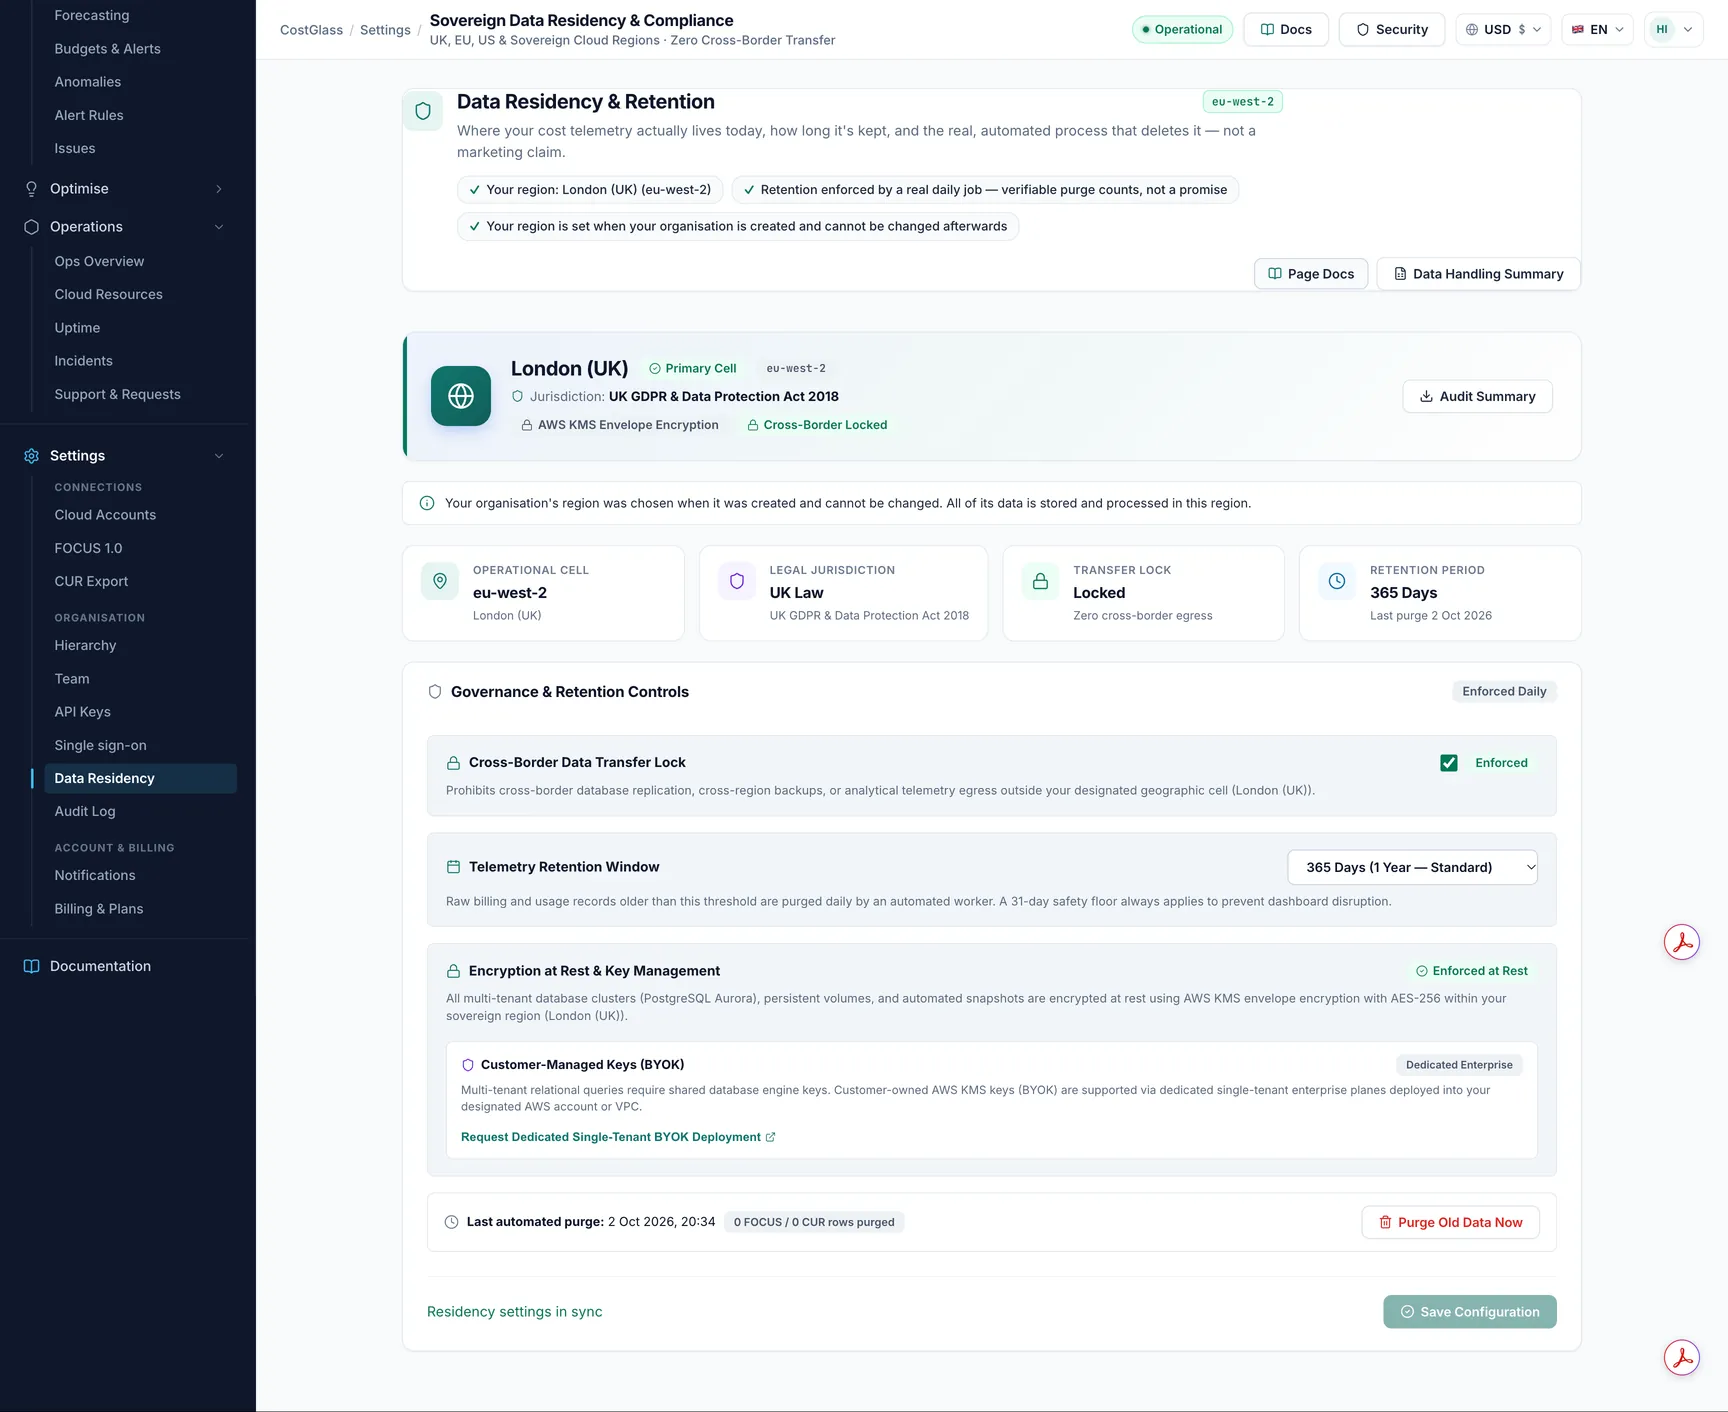
Data Residency open this page
Where your data is processed, how long cost records are kept, and a button to purge older records now.
What to expect: Retention is enforced automatically each day.
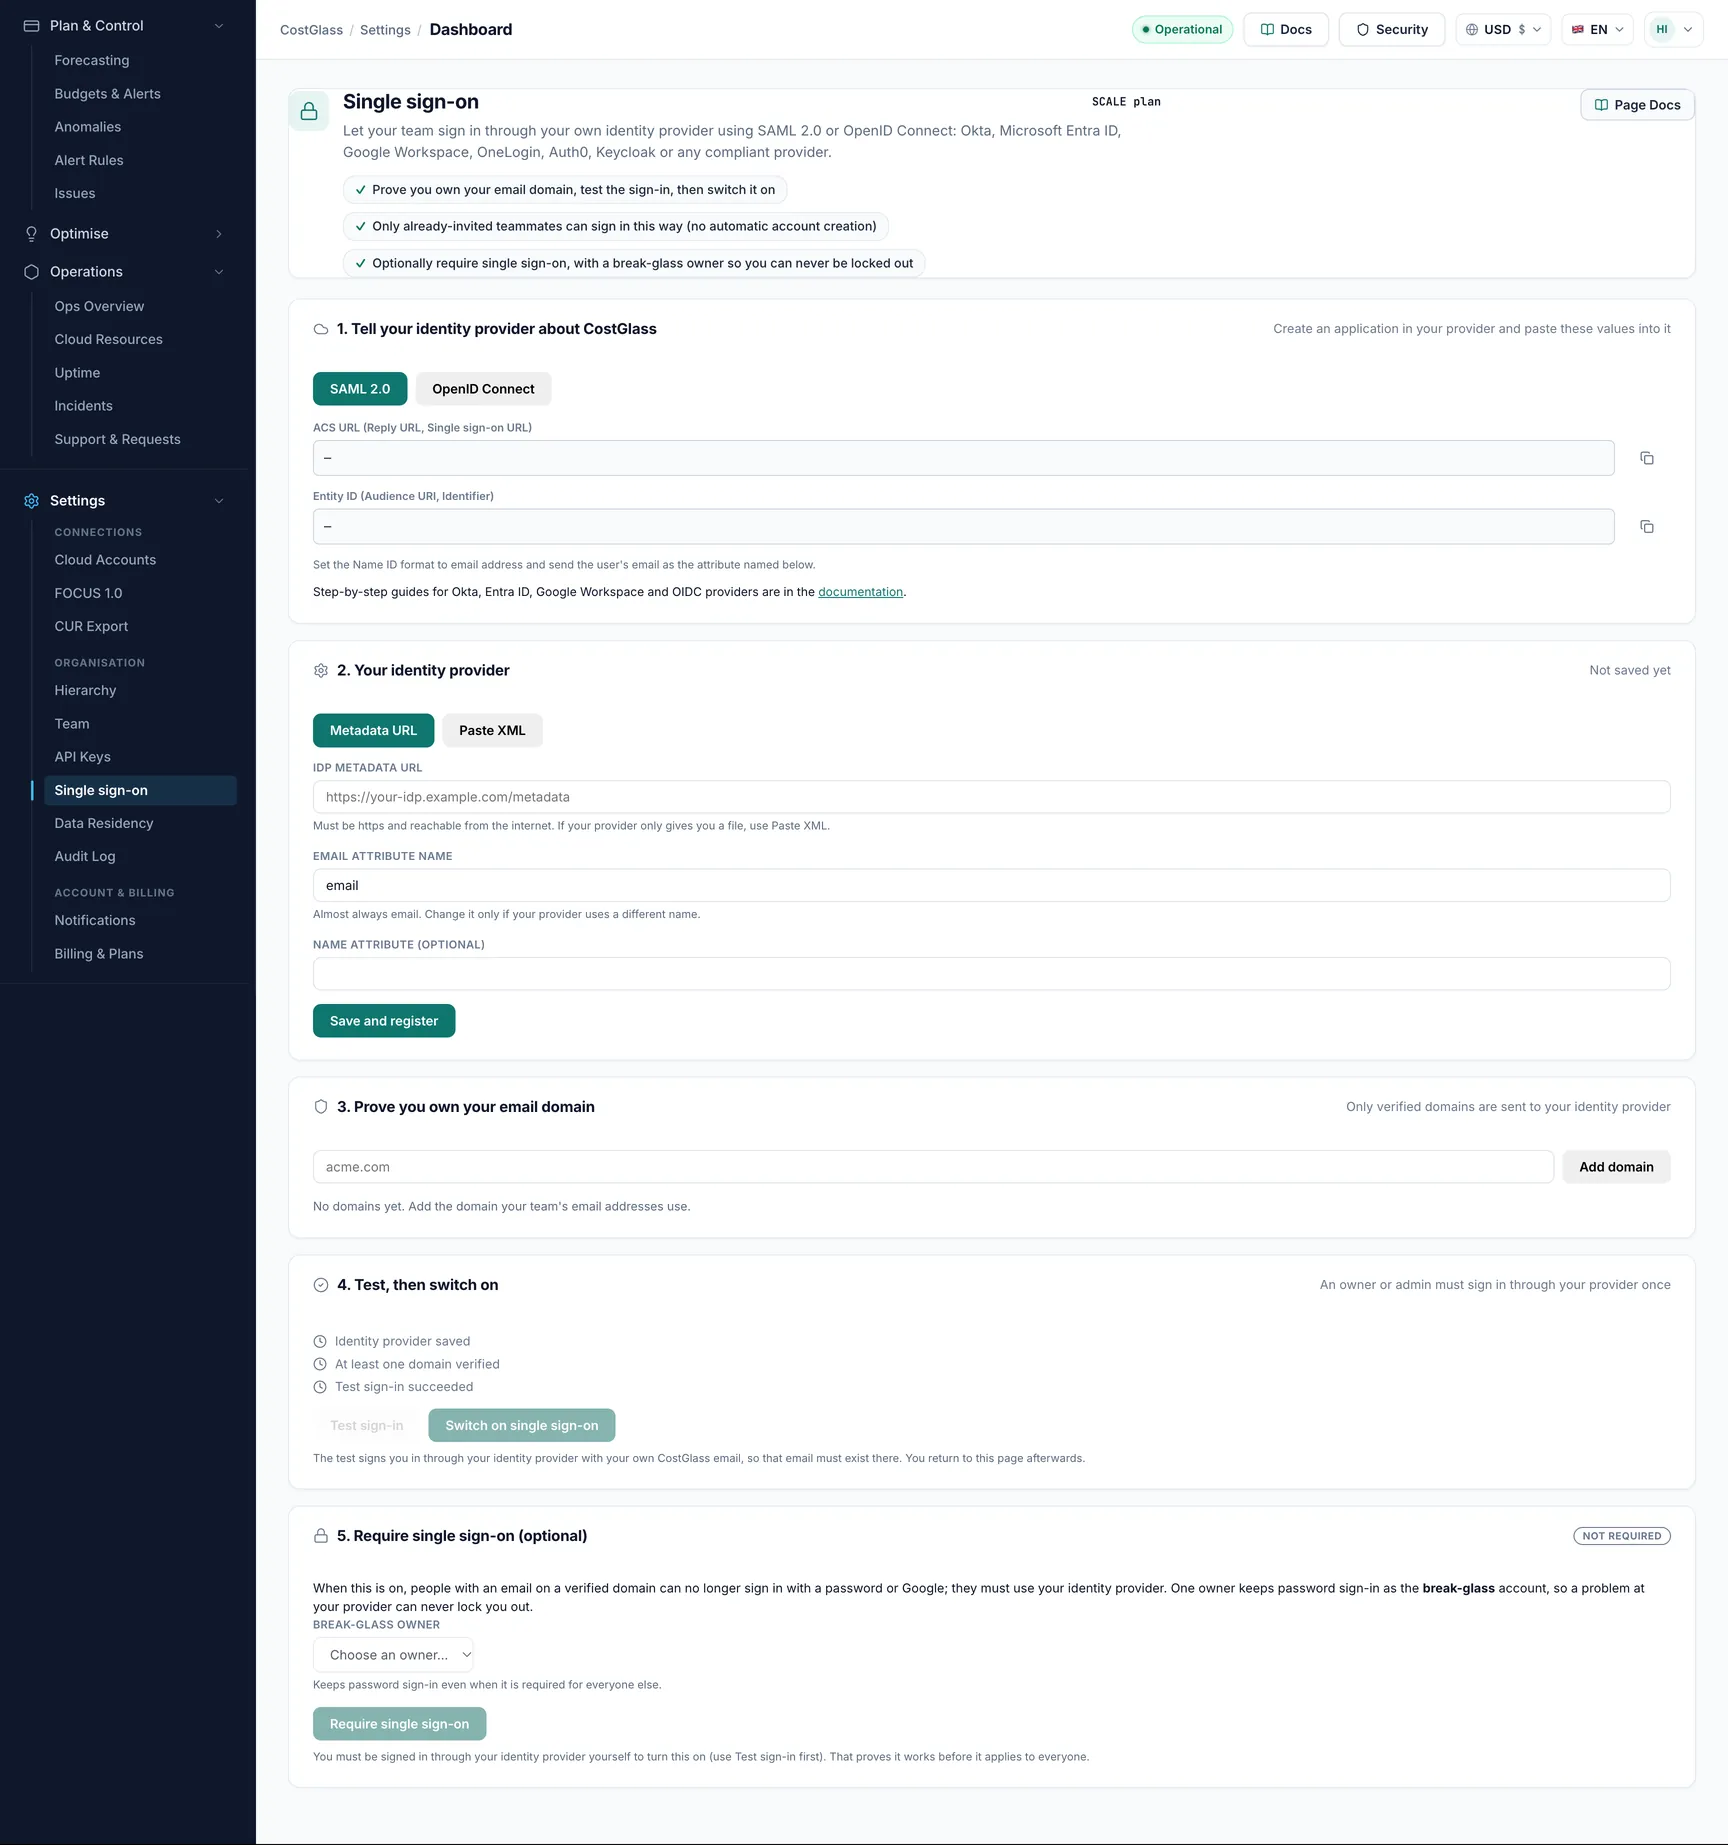
SAML SSO open this page
Connect your own identity provider (Okta, Entra ID, OneLogin and others) so your team signs in with company credentials.
What to expect: Included on the Scale and Enterprise plans. People must be invited first; single sign-on does not create users on its own.
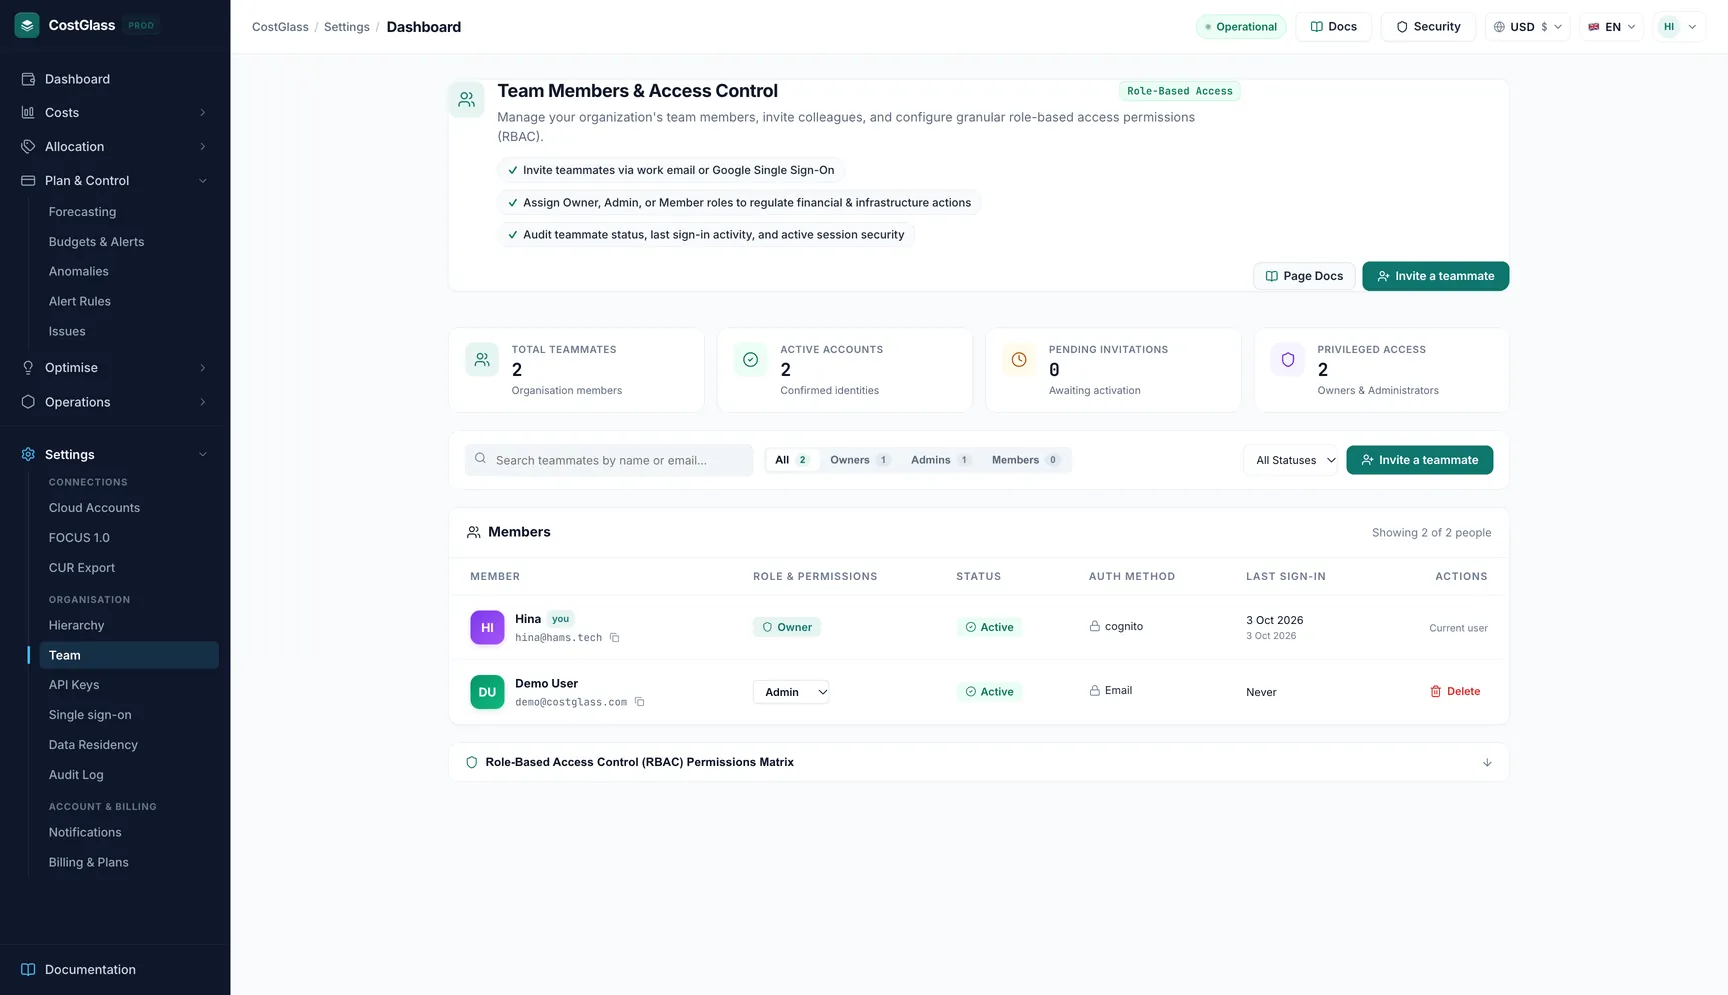
Team open this page
Invite colleagues and set their role (owner, admin or member).
What to expect: An invitation email carries a temporary password, or they can sign in with Google.