Forecasting
Forecast month-end spend, the next months and a yearly run-rate, and simulate the cost of changes.
Forecasting
See where this month's cloud and AI spend is heading, what the next few months may look like, and what a change in your infrastructure would do to the bill.
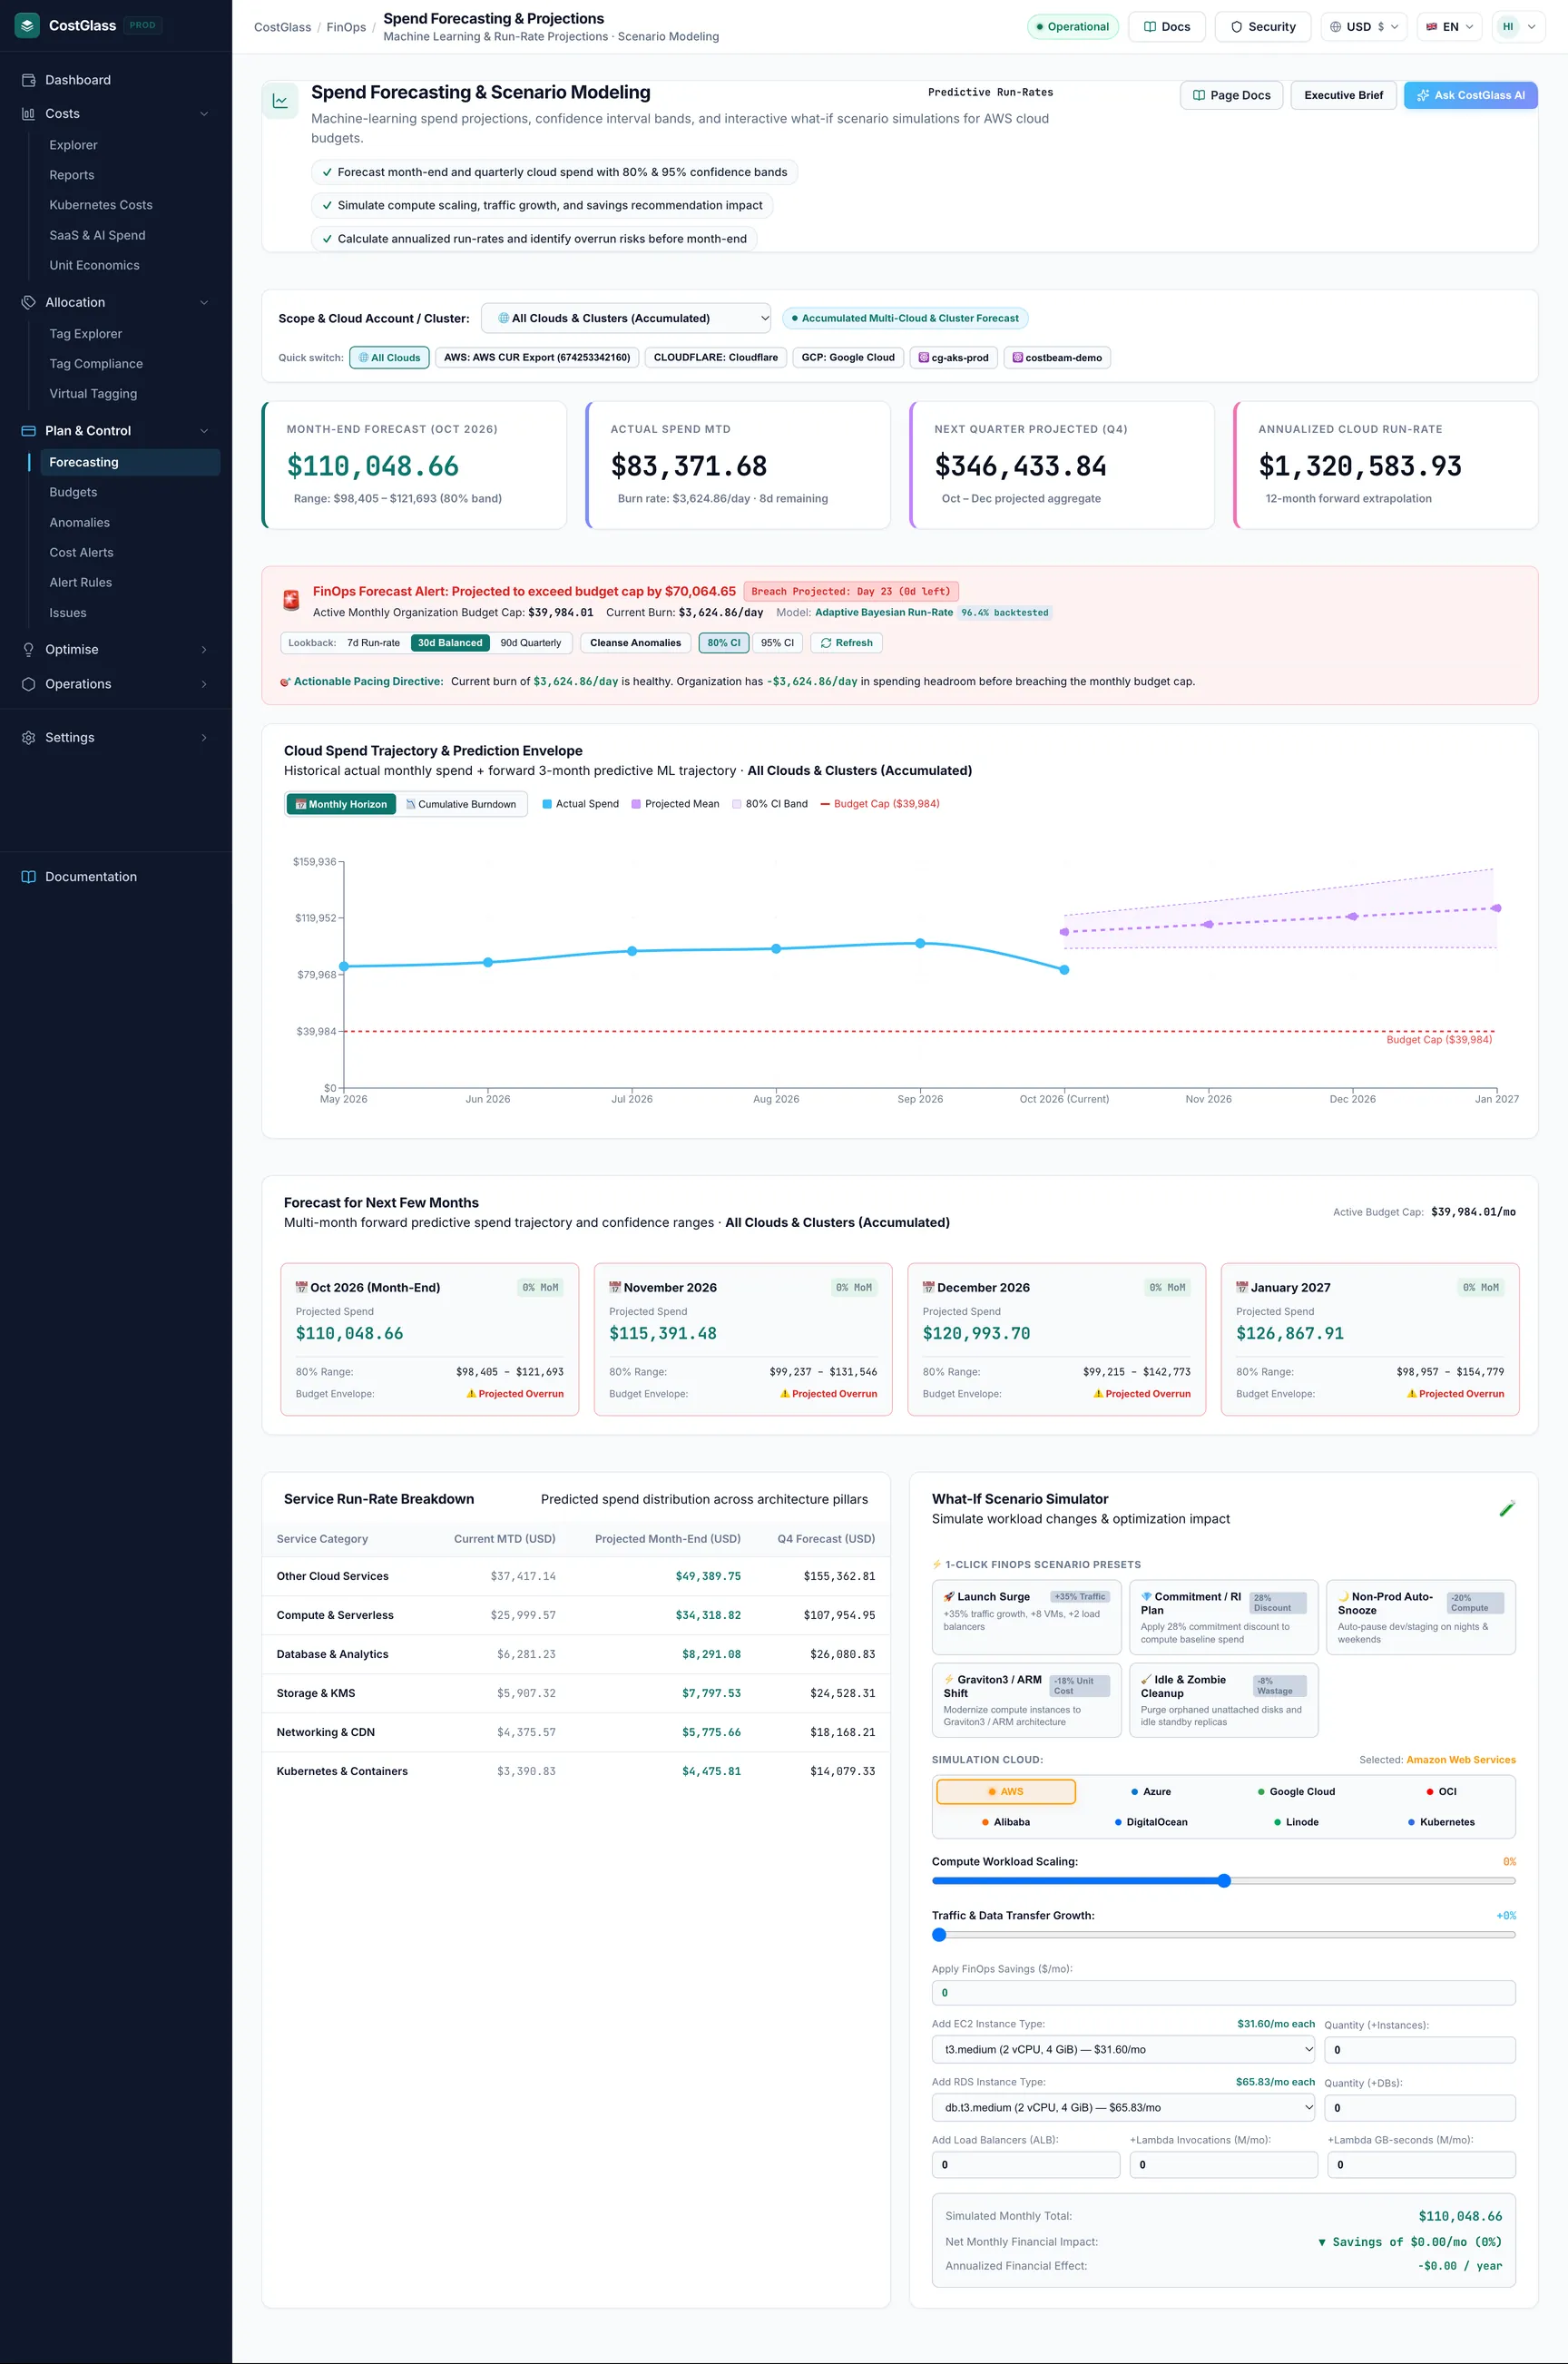
- A forecast is an estimate of spend that has not happened yet. CostGlass forecasts month-end spend, the next three months and a yearly run-rate.
- The month-end figure blends two views: what you are spending per day right now, and what you spent in recent complete months.
- The shaded band on the chart is a guide to the possible range. It is a rule-of-thumb band, not a guarantee.
- If you have a budget, the page tells you whether the forecast is on track, close to the limit, or over it, and on which day you would cross it.
- The What-If Scenario Simulator estimates the monthly effect of adding servers, databases, load balancers or serverless usage, or of applying savings.
What forecasting is for
The bill from your cloud provider arrives after the month ends. A forecast tells you during the month whether you are heading for a surprise. Typical uses:
- Month-end check. Is this month going to land inside budget? If not, you still have days left to act.
- Setting a budget. Use the forecast as a realistic starting number for a budget.
- Planning a commitment. A steady forecast is a good sign that a Savings Plan or reservation will be well used. See the savings playbook.
- Planning a change. Use the simulator before a launch to see roughly what extra capacity will cost.
Before you begin
- At least one cloud or AI account connected with spend already collected.
- Best results come with one to three complete months of history. With less history the forecast leans on the current month only.
- Optional: one or more budgets. Without a budget the page still forecasts, but the alert strip says "No budget configured for this scope".
How the forecast is calculated
You do not need to know this to use the page, but it explains why the number moves the way it does.
Two views of the month
- Run-rate view
- Spend so far this month, plus your average daily spend so far multiplied by the days left. It reacts quickly to what is happening now.
- History view
- A weighted average of your last complete months (up to three, with the newest counting most: 20%, 30% and 50%), then moved up or down by your recent month-on-month growth. Growth is capped at 15% either way so one odd month cannot swing the result.
How they are blended
- Early in the month there is little data, so the forecast leans on history.
- As the month fills in, it leans more on the run-rate. The run-rate share is the fraction of the month elapsed, raised to the power 1.2, and never below 15%.
- If you have already spent more this month than the history view expected for the whole month (for example you added a new account), the forecast uses the run-rate only.
- With no history at all, the run-rate is used. With history but no spend yet this month, the history view is used.
Live AWS connections
If your AWS connection is a live API connection (not a cost-and-usage-report export), CostGlass asks AWS Cost Explorer for its own forecast and uses that figure, together with AWS's own range, instead of the blended model. The model name shown on the page tells you which was used:Adaptive Bayesian Run-Rate is CostGlass's blend, and AWS Cost Explorer ML Model is AWS's forecast.
The band around the forecast
The shaded band is a rule of thumb that widens the further ahead it looks. It is not calculated from the ups and downs of your own data. For the current month the 80% band is about 8% plus up to 10% more depending on how much of the month is left; the 95% band is about 14% plus up to 16%. For later months the band widens by a few percentage points per month. When AWS Cost Explorer supplies the forecast, its own range is used.
Choosing what to forecast
The controls at the top of the chart
| Control | What it does | Notes |
|---|---|---|
| 80% CI | Shows the narrower band. | CI stands for confidence interval. 80% is the default. |
| 95% CI | Shows the wider band. | A wider band is a more cautious range. |
| Refresh | Recalculates now instead of using a stored result. | Results are otherwise reused for up to 15 minutes. |
| [object Object] (7d Run-rate, 30d Balanced, 90d Quarterly) | Intended to choose how much history the forecast learns from. | In the current version this choice does not change the figures. The forecast always uses the method described above. |
| Cleanse Anomalies | Intended to ignore one-off spikes when forecasting. | In the current version this switch does not change the figures. |
The four KPI cards
| Card | What it shows | How it is worked out |
|---|---|---|
| Month-End Forecast | Expected total spend for the current calendar month, with the range for the chosen band. | The blend described above. |
| Actual Spend MTD | What you have spent so far this month (MTD means month to date), your daily burn rate and the days left. | Spend so far divided by the days the recorded data covers. |
| Next Quarter Projected | A three-month total. | This month's forecast plus the next two months, each grown by your recent growth rate. The card carries a fixed quarter name in its label, but the sum is "this month and the next two". |
| Annualized Cloud Run-Rate | What a year would cost at this month's pace. | Month-end forecast multiplied by 12. A single unusual month will distort it. |
Figures are shown in the currency you have chosen in the app. Behind the scenes CostGlass stores a fixed-rate unit and converts it for display, so the numbers match the rest of the product.
The budget alert strip
Under the header there is a coloured strip headed FinOps Forecast Alert. It compares the month-end forecast with your budget for the same scope.
| State | When | Message you see |
|---|---|---|
| No budget | No budget exists for the scope. | No budget configured for this scope. Set one on the Budgets page. |
| On track | Forecast is below 80% of the budget. | Within budget envelope, with the surplus shown. |
| High alert | Forecast is between 80% and 100% of the budget. | Approaching the percentage of the monthly budget cap. |
| Critical overrun | Forecast is over 100% of the budget. | Projected to exceed the budget cap by an amount. |
- Breach Projected: Day N appears when you are forecast to go over. It is the day of the month on which, at your current daily burn, spend would reach the budget.
- Active Monthly Budget is the total of the budget limits that apply to the scope. For the whole organisation this is every budget added together, so two overlapping budgets are both counted.
- The strip also shows your current burn per day. The required daily burn is the budget left divided by the days left: stay under it and you finish inside budget.
- Model Remediation Scenarios jumps to the simulator.
The trajectory chart
The chart has two views, chosen with the buttons above it.
Monthly Horizon
Titled Cloud Spend Trajectory & Prediction Envelope. It shows recent complete months as Actual Spend, then the current month and three future months as Projected Mean, with the CI Band around the projection. If a budget exists, a red Budget Cap line is drawn across.
Cumulative Burndown
Titled Month-to-Date Cumulative Spend & Budget Burndown. It shows spend building up day by day through the month toward the budget ceiling. The past part is drawn as a straight line at your month's average daily spend, so it shows the pace, not each day's real figure. For real day-by-day figures use Cost Explorer.
The tables under the chart
Forecast for Next Few Months
Lists the current month and the three months after it, each with a projected mean and a range, next to the budget cap. Later months grow from the current forecast by your recent growth rate.
Service Run-Rate Breakdown
Splits the forecast across six groups: Compute & Serverless, Storage & KMS, Database & Analytics, Networking & CDN, Kubernetes & Containers and Other Cloud Services. Columns are Current MTD, Projected Month-End and Q4 Forecast. Each group keeps its current share of spend, so the table shows where the money goes, not an independent forecast per group. For a Kubernetes scope the first column is Workload / Namespace.
What-If Scenario Simulator
The simulator asks "if I made this change, what would a typical month cost?". It starts from your month-end forecast and adds or removes the cost of the changes you describe.
| Driver | Range / input | How it is priced |
|---|---|---|
| Compute Workload Scaling | -50% to +50%, in steps of 5 | Applied to roughly 45% of the baseline, which is the share we assume is compute. |
| Traffic & Data Transfer Growth | 0% to +100%, in steps of 10 | Applied to roughly 25% of the baseline, the share we assume is traffic related. |
| Apply FinOps Savings | An amount per month | Subtracted from the total. Use a figure from your Savings page. |
| Add instances / VMs | A count and an instance type | Count multiplied by the monthly price of that type in the built-in catalogue. |
| Add databases | A count and a database instance type | Same method, using the database catalogue. |
| Add load balancers | A count | Count multiplied by the monthly price of one load balancer for the chosen cloud. |
| Add serverless usage | Millions of invocations, and millions of GB-seconds | Millions multiplied by the per-million price for requests and for compute time. |
Your month-end forecast is steady and your budget is close. You expect traffic to rise by a third and plan eight more servers. Choose Launch Surge, set the instance type you plan to use and read Net Monthly Financial Impact. If the simulated month is flagged as exceeding the budget, you now know to raise the budget, or to offset the cost with Idle & Zombie Cleanup, before the launch.
Executive Brief and CostGlass AI
- Executive Brief opens a one-page summary of the forecast (month-end figure, budget position, annualised run-rate) that you can copy as text with Copy Markdown and paste into a report or message.
- Ask CostGlass AI opens a chat panel that answers questions about your forecast using your own data. Treat its answers as a starting point and check the numbers on the page.
Using forecasts well
- Check mid-month. Around the 10th to the 15th the run-rate has enough days behind it to be useful.
- Set budgets from the forecast. A budget a little above a steady forecast is realistic. See Budgets.
- Pair with cost alerts. Forecasting tells you the direction. Cost alerts and anomaly detection tell you when something changes.
- Be careful after big changes. After a migration or a new account, history no longer describes your spend. The run-rate view adapts first.
Limits to be aware of
- The forecast is a statistical guess, not a promise. Credits, refunds, price changes and one-off charges can all move the real bill.
- The band is a rule of thumb, not a measured probability.
- The Lookback and Cleanse Anomalies controls do not change the numbers yet.
- The page forecasts the current calendar month and the three after it, not a custom date range.
- Clouds that report only monthly totals are included, but they add no daily detail, so a mid-month run-rate for them is rough.