Rightsizing
Find servers and databases that are too big, or too small, using real CPU and memory measurements.
Rightsizing
Rightsizing compares how big each server or database is with how much of it you actually use, and recommends a smaller size (or a larger one) based on real measurements.
- Recommendations come from measured CPU and memory only. No metrics means no recommendation, and the page says why.
- For AWS you need the Rightsizing feature turned on in your CostGlass stack, and about 7 days of metrics (12.5 days for idle checks).
- CPU is always available. Memory is only measured if you install the CloudWatch agent; without it, confidence is lower.
- Prices are on-demand list prices from CostGlass’s own approximate tables, so treat savings as a guide.
- CostGlass never resizes anything. You make the change yourself, ideally in a test environment first.
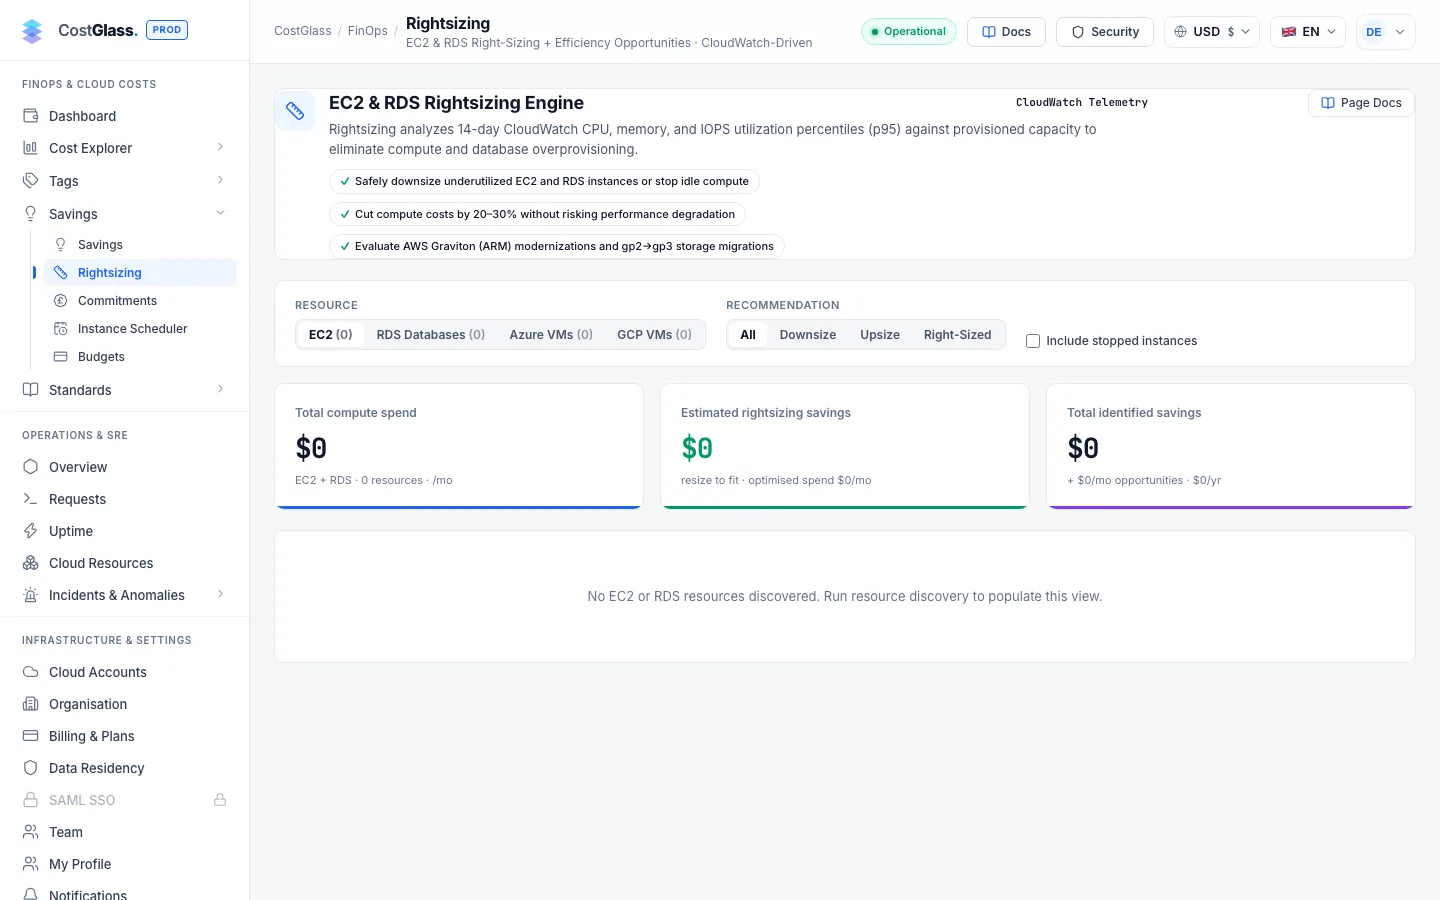
What rightsizing means
When someone creates a server they often choose a generous size "to be safe", and it is never revisited. You pay for the whole size every hour, even if it uses a fraction. Rightsizing finds those servers and suggests the next size down in the same family, which lowers the price of that server. It also flags servers that are running too hot, where a larger size would protect your customers.
- CPU p95
- The 95th percentile of CPU use: the level that was exceeded only 5% of the time. It describes the busy times, ignoring the very rarest spikes. It is a better guide to "how big does this need to be" than the average.
- Memory p95
- The same measure for memory.
- Family and size
- A server type such as m6i.large has a family (m6i) and a size (large). CostGlass recommends the neighbouring size in the same family, one step at a time, because that is the safest change.
- Confidence
- How much evidence sits behind a recommendation: High, Medium or Low (explained below).
Where the measurements come from
| Cloud | Source | What you need to do |
|---|---|---|
| AWS EC2 and RDS | Amazon CloudWatch (GetMetricData, last 14 days, hourly). Memory comes from the CloudWatch agent (CWAgent) if it is installed. AWS Compute Optimizer is read too, as a second opinion shown on each row. | Turn on Rightsizing in your stack; install the CloudWatch agent for memory; optionally opt in to Compute Optimizer. |
| Azure virtual machines | Azure Monitor (CPU, plus available memory where the VM reports it). | Nothing extra. Reader access is enough. |
| Google Cloud | Cloud Monitoring is not read today, so VMs show Needs metrics access. | Nothing available yet. |
| Kubernetes | OpenCost: efficiency of each workload’s container requests. | Connect OpenCost. See Kubernetes costs. |
| AI models | Your real OpenAI or Anthropic spend by model. | Connect the AI platform. |
Set it up (AWS)
- An AWS account connected with live access (not only a billing export).
- Someone who can deploy or update a CloudFormation stack in that account.
- Servers that have been running for at least a week.
mem_used_percent. Without it, CPU-only recommendations are still made, but at lower confidence and with a reminder to check memory first.The rules CostGlass applies
The thresholds are fixed and apply to every customer.
| Recommendation | When it is made | Evidence needed |
|---|---|---|
| Downsize | CPU p95 below 40%, and memory p95 below 40% when memory is measured, and the one-size-smaller server would still stay at or below 80% p95 after the change. The saving must also be more than 5% of the current price. | 7 days |
| Upsize | CPU p95 at or above 85%, or memory p95 at or above 90%. Shown as an extra cost (a negative saving) and not included in savings totals. | 7 days |
| Idle | EC2: average CPU below 3%, p95 below 10% and network below 100 MB a day. RDS: no database connections at all. | 12.5 days |
| Right-sized | Nothing above applies. Leave it alone. | 7 days |
| No utilisation data | Not enough history, not running, no region recorded, or CloudWatch returned nothing. The row states the reason. | - |
| Needs metrics access | CostGlass cannot read metrics for this cloud (currently Google Cloud VMs). | - |
Confidence
| Level | When |
|---|---|
| High | At least 12.5 days of data and memory was measured. |
| Medium | At least 12.5 days of data but memory was not measured. Or high confidence lowered because short bursts reach the current size’s limit. |
| Low | Between 7 and 12.5 days of data, or medium lowered because of bursts. |
If bursts (the peak, not p95) would exceed the smaller server’s capacity, the explanation says so: "short bursts reach the current size’s limit, so check peak load before resizing".
How to read the page
Header cards
- Total Fleet & AI Spend
- Estimated monthly cost of the resources analysed, at list price.
- Rightsizing Savings (measured)
- The sum of savings from recommendations based on measured utilisation. Estimates for resources without metrics are not included. Before data exists this card reads "No utilisation data yet".
- Total Identified Savings
- Rightsizing savings plus the extra efficiency opportunities listed lower on the page.
Platform tabs and filters
Choose a platform with All Platforms, Kubernetes, AWS, Azure, Google Cloud or AI Models (the number in brackets is how many items it holds). Under Recommendation choose All, Downsize, Idle, Upsize, Right-sized or No data. Tick Include stopped to include servers that are not running.
| Control | Options |
|---|---|
| Search by name, ID, provider, or size… | Free text. |
| All regions / clusters | Limit to one region or Kubernetes cluster. |
| Any confidence | High, Medium or Low. |
| Sort | Biggest saving first (default), Highest cost first, Name A–Z. |
The table
| Column | What it tells you |
|---|---|
| Resource / Workload | Name, cloud badge, region and state. |
| Current Spec | Instance type with vCPU and memory. |
| Current £/mo | Estimated monthly list price now (shown in your chosen currency). |
| CPU p95 | Bar showing busy-time CPU. A dash means not measured. |
| Mem p95 | Same for memory. A dash means memory is not measured (see the CloudWatch agent). |
| Recommended Size / Tier | The verdict pill and, for downsize or upsize, the target type. |
| New £/mo | List price of the recommended size. |
| Saving £/mo | The difference. A negative amount (amber) is an upsize cost. |
Click a row to expand it: CPU average and p95, memory p95, peak network or connections, the data source, AWS Compute Optimizer’s finding (if you opted in), confidence, new capacity and a plain-English rationale.
Extra opportunities
Below the table, Cross-Platform Optimization Opportunities lists efficiency wins found from your inventory: unattached disks, previous-generation instance types, Graviton or ARM moves, prompt caching and batch APIs for AI. These are not measured utilisation and are kept separate from the measured savings total.
How to carry out a recommendation safely
Honest limits
- No metrics, no recommendation. CostGlass does not model or guess utilisation. A server it cannot measure is shown with the reason.
- Prices are approximate. They are on-demand list prices from CostGlass’s built-in tables. Reserved or Savings Plan pricing, credits and discounts are not applied, so real savings can differ. Azure memory and prices are approximations too.
- Only the neighbouring size in the same family is suggested. Moving to a different family (for example to Graviton) appears as an extra opportunity, not a measured recommendation.
- Metrics cover the last 14 days. A quiet fortnight can hide a busy month-end.
- Google Cloud VMs show Needs metrics access: CostGlass does not yet read Cloud Monitoring.
- The AI model suggestions on this page use fixed assumptions about model tiers and are not part of the measured total.
- Sizing results depend on resource discovery. A server that has not been discovered will not appear.