Multi-Cloud Cost Allocation: Building Board-Ready Showback and Chargeback Matrices
Establish audit-ready cloud showback and chargeback matrices. Learn how CostGlass uses Virtual Tagging to allocate 100% of untagged multi-cloud costs.
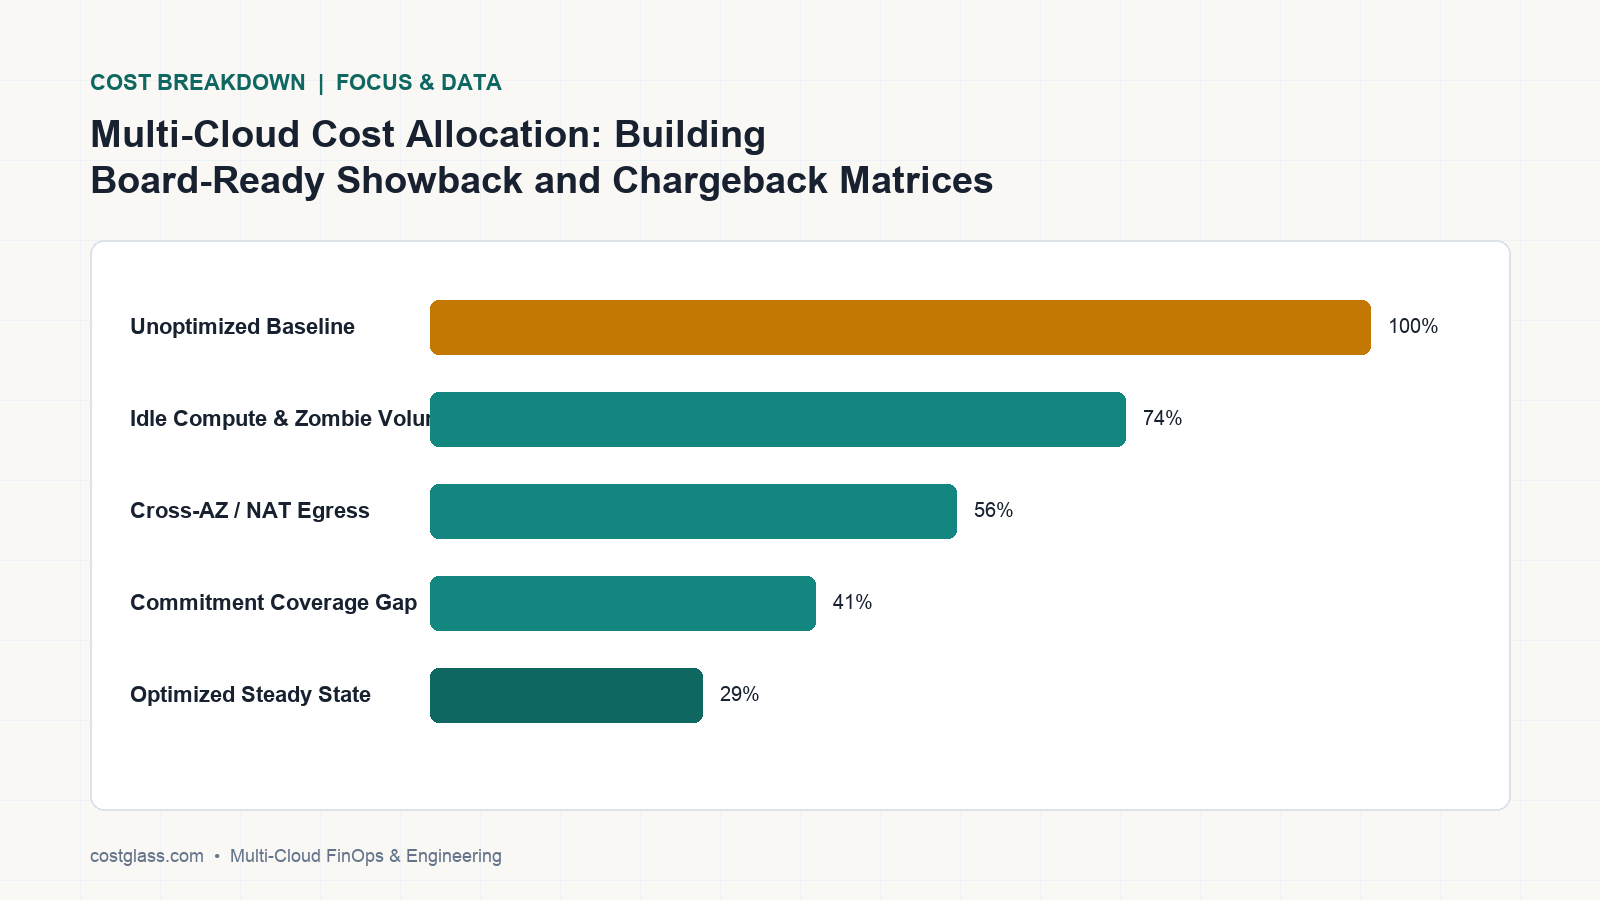
Multi-cloud cost allocation—the process of attributing 100% of cloud, container, and AI spend to business units—fails when relying on legacy manual tags. By utilizing programmatic Virtual Tagging and multi-tenant organizational hierarchies, finance and engineering leaders can build board-ready showback and chargeback matrices. CostGlass automates this allocation under a flat-rate model, eliminating manual tag compliance friction entirely.
The Strategic Imperative of Multi-Cloud Cost Allocation
For modern technology businesses operating across multiple cloud providers, container orchestration platforms, and SaaS tools, cloud spend is rarely a single line item. Instead, it is a complex, dynamic web of infrastructure, databases, third-party data platforms, and Large Language Model (LLM) APIs.
Without a robust allocation framework, finance and engineering leaders cannot answer fundamental business questions:
- What is the exact gross margin of our primary SaaS product?
- Which customer accounts are eroding our profitability due to unallocated database or API transactions?
- How should we split shared infrastructure costs—such as network transit, NAT Gateways, and Kubernetes idle capacity—between engineering departments?
To solve this, organizations implement two primary financial governance methodologies:
- Showback: Providing engineering teams and business units with daily cost visibility, establishing financial accountability, and identifying anomalies without executing internal budget transfers.
- Chargeback: Generating ledger-backed, audit-ready financial reports that directly debit internal business unit budgets or attribute costs directly to Cost of Goods Sold (COGS) for corporate accounting.
However, implementing these methodologies across AWS, Azure, GCP, Kubernetes, Snowflake, and OpenAI is historically difficult. Shared resources create a "black box" of unallocated spend that obscures true unit economics.
Why Legacy Tagging Strategies Fail: The Build-vs-Buy Reality
Historically, platform engineers attempted to solve cost allocation by forcing developers to manually tag every resource in Terraform or CloudFormation. This approach fails at scale for several structural reasons:
- Unsupported Resources: Not all cloud resources support tagging. Network interfaces, IP addresses, and certain serverless components cannot carry metadata.
- Human Error and Schema Drift: Over time, tag keys drift. A single tag key represented as
Environment,env, orenvironmentsplits billing data into three separate silos. - Retroactive Changes are Impossible: If a resource was untagged or mistagged for six months, mutating the resource tag in AWS today does not fix the historical billing records in your Cost and Usage Report (CUR).
The Engineering Economics of "Build vs. Buy"
Faced with these limitations, some engineering teams attempt to build a custom in-house cost normalization and allocation pipeline. They write custom ETL scripts to ingest AWS CUR 2.0 files, Azure MCA exports, and GCP BigQuery datasets, attempting to parse, clean, and map these records into a unified database.
This DIY path is a massive engineering and maintenance trap:
- Fragile Billing Schemas: Cloud providers frequently update their billing export formats. A single schema change can break internal pipelines, leading to corrupted financial reporting.
- High Payroll Overhead: Building and maintaining a custom multi-cloud cost pipeline requires continuous dedication from senior data engineers and SREs. This diverts engineering resources from shipping revenue-generating product features, costing upwards of $100,000/year in payroll overhead just to maintain a fragile internal dashboard.
- Latency Issues: DIY pipelines rarely achieve real-time visibility, often running on a 24-to-48-hour delay that misses critical cost spikes.
Instead of wasting engineering capital on custom pipelines, scaling organizations choose CostGlass. CostGlass unifies 13 native multi-cloud, Kubernetes, and AI connectors into a single, normalized ledger that refreshes every 6 hours, allowing teams to implement retroactive, programmatic allocation rules without mutating a single cloud tag.
Architecting Board-Ready Showback and Chargeback Matrices
To build an audit-ready financial framework, platform and finance teams must transition from manual tagging to programmatic allocation. This is achieved through a structured four-step methodology:
Step 1: Define the Organizational Hierarchy
Before allocating costs, you must define the target structure of your business. Map AWS accounts, Azure subscriptions, GCP projects, and SaaS connectors into a multi-level tree of Business Units, Departments, and Teams.
This ensures that any cost assigned to a leaf node automatically rolls up to parent entities, establishing a clear line of sight from individual developer sandboxes to the corporate P&L.
Step 2: Isolate Direct vs. Shared Costs
Not all cloud costs are created equal. Your allocation model must separate:
- Direct Costs: Resources dedicated to a single product, environment, or customer (e.g., an AWS RDS instance labeled with a specific customer ID).
- Shared Costs: Infrastructure that supports multiple business units (e.g., AWS NAT Gateways, shared Kubernetes clusters, Snowflake data warehouses, or centralized Datadog logging environments).
Step 3: Programmatic Allocation via Virtual Tagging
Instead of relying on developers to tag resources, use Virtual Tagging to evaluate complex logical rules at the platform layer. Virtual Tagging compiles nested boolean groups, regular expressions, and value mapping into a parameterized query over your unified billing ledger.
For example, if an untagged EC2 instance belongs to an AWS account named prod-billing-service, a Virtual Tag rule can automatically assign 100% of its cost to the "Billing Department" under the "Core Platform" business unit. This allocation is retroactive, instantly cleaning up historical data without causing Terraform drift.
Step 4: Distribute Idle and Common Overhead
Shared costs must be distributed using equitable allocation rules:
- Pro-Rata Distribution: Allocating shared network transit or support costs proportionally based on each department's direct spend.
- Even Split: Dividing common platform overhead equally among active engineering teams.
- Kubernetes Idle Capacity: Allocating unallocated node capacity back to the namespaces and pods that caused the nodes to scale out, ensuring true container cost accountability.
Executive ROI: Why CostGlass Beats Legacy Platforms
When evaluating multi-cloud cost allocation tools, executives often compare CostGlass to legacy platforms like CloudZero, Vantage, Finout, and IBM Cloudability. Legacy tools often introduce opaque, predatory pricing models that charge a percentage of your cloud spend or savings, effectively penalizing your engineering efficiency.
CostGlass operates on a transparent, predictable flat monthly pricing model with rolling monthly billing, ensuring you keep 100% of every dollar saved:
- Free: $0 (up to £5,000/mo cloud spend cap)
- Starter: $99/mo (up to £15,000/mo cloud spend cap)
- Growth: $499/mo (up to £50,000/mo cloud spend cap)
- Scale: $1,499/mo (up to £100,000/mo cloud spend cap; includes 8 dedicated senior DevOps/FinOps engineer-hours every month to write Terraform PRs, rightsize instances, and execute optimizations)
- Enterprise: Custom pricing (> £100,000/mo cloud spend cap; includes private, in-account AWS BYOC deployment)
| Feature / Capability | CostGlass | CloudZero | Finout | IBM Cloudability |
|---|---|---|---|---|
| Pricing Model | Predictable Flat Monthly (from $0 to $1,499) | Percentage-of-spend / Opaque annual contract | Opaque annual contract + percentage-of-spend | Opaque annual contract |
| Kubernetes Allocation | Included at $0 extra | Included in annual contract | +25% add-on fee | Included in enterprise tier |
| Unit Economics Cost | Included at $0 extra | Included in annual contract | +$250-$500/mo extra | Included in enterprise tier |
| Hands-on Execution | Yes (8 SRE hours/mo on Scale) | No (software recommendations only) | No (software recommendations only) | No (software recommendations only) |
| Data Refresh Rate | 6 Hours | 12 to 24 Hours | 12 to 24 Hours | 24 to 48 Hours |
| Sovereign BYOC Deployment | Yes (Private AWS VPC deployment available) | No (US-hosted SaaS only) | No (US-hosted SaaS only) | No (US-hosted SaaS only) |
By replacing legacy platforms with CostGlass, organizations eliminate the "cloud tax" on their growth while receiving hands-on engineering execution to actually implement savings, rather than just adding items to an unmanaged Jira backlog.
How to Configure Showback and Chargeback in CostGlass
Establishing an automated, board-ready cost allocation matrix inside CostGlass takes less than 30 minutes:
Step 1: Connect Your Multi-Cloud and SaaS Accounts
Deploy a read-only IAM role to your AWS, Azure, GCP, or SaaS accounts. For AWS, you can use our 1-click CloudFormation template or generate a custom Terraform module using the CostGlass AWS Connection Guide. CostGlass will automatically begin importing and normalizing your historical billing records.
Step 2: Establish Your Organizational Hierarchy
Navigate to Settings > Org Hierarchy inside the CostGlass console. Create your corporate tree by adding Business Units, Departments, and Teams. Drag and drop connected cloud accounts, subscriptions, or GCP projects into their respective nodes. For advanced setups, consult the CostGlass Org Hierarchy Design Guide.
Step 3: Write Programmatic Virtual Tag Rules
Navigate to FinOps > Virtual Tagging to build your allocation rules. You can map untagged resources using logical filters (e.g., mapping all resources where Provider Account equals staging-ecs to the QA Team).
{
  "virtual_tag_key": "VTAG:department",
  "rules": [
    {
      "target_value": "Engineering-QA",
      "conditions": {
        "any": [
          { "field": "account_name", "contains": "staging" },
          { "field": "tag:env", "equals": "qa" }
        ]
      }
    }
  ]
}
Learn more about logical syntax in the Virtual Tagging Documentation.
Step 4: Generate and Schedule Board-Ready Reports
Open the Cost Explorer and group your costs by your newly created VTAG:department. Filter out unallocated spend to view your clean showback matrix. Save this view and schedule it to automatically export as an Excel (.xlsx) or PDF board pack to your executive team and finance department every month using the CostGlass Reports Library.
Frequently Asked Questions
How does Virtual Tagging avoid causing Terraform drift?
Traditional tagging methods require you to modify your infrastructure code (such as Terraform or CloudFormation) to apply tags directly to live cloud resources. This often causes state-file conflicts, deployment delays, and Terraform drift. CostGlass Virtual Tagging compiles allocation rules into a parameterized SQL layer over your normalized billing data. It is completely non-intrusive, executing virtual metadata mappings without modifying your live cloud resources.
Can we allocate shared container and data warehouse costs?
Yes. CostGlass natively integrates with CNCF OpenCost to parse EKS, AKS, and GKE container metrics down to the pod, namespace, and GPU level. Additionally, our Snowflake integration tracks warehouse credit burn and cloud services overage. Using Virtual Tagging, you can merge container resources and data warehouse usage into the same business unit allocations as your standard cloud VMs and object storage.
How does CostGlass handle multi-cloud region and account name normalization?
Different cloud providers use varied naming conventions for regions (e.g., AWS uses us-east-1 while Azure uses East US). CostGlass automatically normalizes regional metadata, account names, and service categories into a standardized schema. This allows you to query and compare "Compute" or "Database" costs across AWS, Azure, and GCP side-by-side in a single, unified view.
Ready to eliminate untagged cloud waste and establish audit-ready showback matrices? Explore our CostGlass Comparison Page to see how we beat legacy platforms, check out our Virtual Tagging Guide to master programmatic allocation, or start your 14-day free trial at CostGlass today.
La asignación de costes multi-cloud —el proceso de atribuir el 100% del gasto en cloud, contenedores e IA a unidades de negocio— fracasa cuando depende de etiquetas manuales heredadas. Al utilizar Virtual Tagging programático y jerarquías organizativas multi-inquilino, los líderes de finanzas e ingeniería pueden construir matrices de showback y chargeback listas para la junta directiva. CostGlass automatiza esta asignación bajo un modelo de tarifa plana, eliminando por completo la fricción del cumplimiento manual de tags.
El imperativo estratégico de la asignación de costes multi-cloud
Para las empresas tecnológicas modernas que operan en múltiples proveedores de cloud, plataformas de orquestación de contenedores y herramientas SaaS, el gasto cloud rara vez es una sola partida presupuestaria. Al contrario, es una red compleja y dinámica de infraestructura, bases de datos, plataformas de datos de terceros y APIs de Modelos de Lenguaje Grande (LLM).
Sin un marco de asignación robusto, los líderes financieros y de ingeniería no pueden responder preguntas empresariales fundamentales:
- ¿Cuál es el margen bruto exacto de nuestro producto SaaS principal?
- ¿Qué cuentas de clientes están erosionando nuestra rentabilidad debido a transacciones de bases de datos o APIs no asignadas?
- ¿Cómo debemos dividir los costes de infraestructura compartida —como el tránsito de red, las NAT Gateways y la capacidad ociosa de Kubernetes— entre los departamentos de ingeniería?
Para resolver esto, las organizaciones implementan dos metodologías principales de gobernanza financiera:
- Showback: Proporciona a los equipos de ingeniería y unidades de negocio visibilidad diaria de los costes, estableciendo responsabilidad financiera e identificando anomalías sin ejecutar transferencias presupuestarias internas.
- Chargeback: Genera informes financieros auditables y respaldados por libros contables que debitan directamente los presupuestos de las unidades de negocio internas o atribuyen costes directamente al Coste de Bienes Vendidos (COGS) para la contabilidad corporativa.
Sin embargo, implementar estas metodologías en AWS, Azure, GCP, Kubernetes, Snowflake y OpenAI ha sido históricamente difícil. Los recursos compartidos crean una "caja negra" de gasto no asignado que oscurece la verdadera economía unitaria.
Por qué fracasan las estrategias de etiquetado tradicionales: la realidad de construir frente a comprar
Históricamente, los ingenieros de plataformas intentaron resolver la asignación de costes obligando a los desarrolladores a etiquetar manualmente cada recurso en Terraform o CloudFormation. Este enfoque fracasa a escala por varias razones estructurales:
- Recursos no compatibles: No todos los recursos de la nube admiten etiquetas. Las interfaces de red, las direcciones IP y ciertos componentes serverless no pueden contener metadatos.
- Error humano y desviación del esquema (schema drift): Con el tiempo, las claves de las etiquetas divergen. Una misma clave representada como
Environment,envoenvironmentfragmenta los datos de facturación en tres silos independientes. - Los cambios retroactivos son imposibles: Si un recurso estuvo sin etiquetar o mal etiquetado durante seis meses, modificar la etiqueta del recurso en AWS hoy no corrige los registros de facturación históricos en su Cost and Usage Report (CUR).
La economía de ingeniería de "construir frente a comprar"
Ante estas limitaciones, algunos equipos de ingeniería intentan construir un pipeline interno personalizado de normalización y asignación de costes. Escriben scripts ETL personalizados para ingerir archivos AWS CUR 2.0, exportaciones MCA de Azure y conjuntos de datos de BigQuery de GCP, intentando procesar, limpiar y mapear estos registros en una base de datos unificada.
Esta vía de desarrollo propio es una trampa masiva de ingeniería y mantenimiento:
- Esquemas de facturación frágiles: Los proveedores de cloud actualizan con frecuencia sus formatos de exportación de facturación. Un solo cambio en el esquema puede romper los pipelines internos, lo que genera informes financieros corruptos.
- Altos costes salariales: Crear y mantener un pipeline multi-cloud personalizado requiere la dedicación continua de ingenieros de datos sénior y SREs. Esto desvía recursos de ingeniería del desarrollo de funcionalidades de producto que generan ingresos, costando más de 100.000 $/año en costes laborales solo para mantener un cuadro de mando interno frágil.
- Problemas de latencia: Los pipelines internos rara vez logran visibilidad en tiempo real, operando a menudo con un retraso de 24 a 48 horas que pasa por alto picos de gasto críticos.
En lugar de desperdiciar capital de ingeniería en pipelines a medida, las organizaciones en crecimiento eligen CostGlass. CostGlass unifica 13 conectores nativos de multi-cloud, Kubernetes e IA en un registro único y normalizado que se actualiza cada 6 horas, lo que permite a los equipos implementar reglas de asignación programáticas y retroactivas sin modificar una sola etiqueta en la nube.
Arquitectura de matrices de showback y chargeback listas para la junta directiva
Para construir un marco financiero auditable, los equipos de plataforma y finanzas deben pasar del etiquetado manual a la asignación programática. Esto se logra mediante una metodología estructurada de cuatro pasos:
Paso 1: Definir la jerarquía organizativa
Antes de asignar costes, debe definir la estructura objetivo de su negocio. Mapee cuentas de AWS, suscripciones de Azure, proyectos de GCP y conectores SaaS en un árbol multinivel de Unidades de Negocio, Departamentos y Equipos.
Esto garantiza que cualquier coste asignado a un nodo hoja se agregue automáticamente a las entidades matrices, estableciendo una línea de visión clara desde los entornos sandbox de desarrolladores individuales hasta la cuenta de pérdidas y ganancias corporativa.
Paso 2: Aislar costes directos frente a compartidos
No todos los costes de la nube son equivalentes. Su modelo de asignación debe separar:
- Costes directos: Recursos dedicados a un solo producto, entorno o cliente (por ejemplo, una instancia de AWS RDS etiquetada con un ID de cliente específico).
- Costes compartidos: Infraestructura que da soporte a múltiples unidades de negocio (por ejemplo, AWS NAT Gateways, clústeres de Kubernetes compartidos, data warehouses de Snowflake o entornos centralizados de logs en Datadog).
Paso 3: Asignación programática mediante Virtual Tagging
En lugar de depender de que los desarrolladores etiqueten los recursos, utilice Virtual Tagging para evaluar reglas lógicas complejas en la capa de plataforma. Virtual Tagging compila grupos booleanos anidados, expresiones regulares y mapeo de valores en una consulta parametrizada sobre su registro de facturación unificado.
Por ejemplo, si una instancia EC2 no etiquetada pertenece a una cuenta de AWS llamada prod-billing-service, una regla de Virtual Tag puede asignar automáticamente el 100% de su coste al "Billing Department" bajo la unidad de negocio "Core Platform". Esta asignación es retroactiva y corrige instantáneamente los datos históricos sin provocar desviaciones en Terraform.
Paso 4: Distribuir la capacidad ociosa y los costes generales comunes
Los costes compartidos deben distribuirse mediante reglas de asignación equitativas:
- Distribución prorrateada: Asignación de costes compartidos de soporte o tránsito de red proporcionalmente en función del gasto directo de cada departamento.
- División equitativa: División de los costes generales de plataforma común por igual entre los equipos de ingeniería activos.
- Capacidad ociosa de Kubernetes: Asignación de la capacidad no utilizada de los nodos a los namespaces y pods que provocaron el escalado de dichos nodos, garantizando una auténtica responsabilidad sobre los costes de los contenedores.
ROI ejecutivo: por qué CostGlass supera a las plataformas tradicionales
Al evaluar herramientas de asignación de costes multi-cloud, los ejecutivos a menudo comparan CostGlass con plataformas heredadas como CloudZero, Vantage, Finout e IBM Cloudability. Las herramientas tradicionales suelen introducir modelos de precios opacos y predatorios que cobran un porcentaje de su gasto o ahorro en la nube, penalizando en la práctica la eficiencia de sus ingenieros.
CostGlass opera con un modelo de precio mensual fijo transparente y predecible con facturación mensual continua, asegurando que usted conserve el 100% de cada dólar ahorrado:
- Free: 0 $ (límite de gasto cloud de hasta 5.000 £/mes)
- Starter: 99 $/mes (límite de gasto cloud de hasta 15.000 £/mes)
- Growth: 499 $/mes (límite de gasto cloud de hasta 50.000 £/mes)
- Scale: 1.499 $/mes (límite de gasto cloud de hasta 100.000 £/mes; incluye 8 horas dedicadas al mes de ingenieros sénior de DevOps/FinOps para redactar PRs de Terraform, redimensionar instancias y ejecutar optimizaciones)
- Enterprise: Precio personalizado (límite de gasto cloud > 100.000 £/mes; incluye despliegue privado BYOC en su propia cuenta de AWS)
| Característica / Capacidad | CostGlass | CloudZero | Finout | IBM Cloudability |
|---|---|---|---|---|
| Modelo de precios | Tarifa mensual fija predecible (de 0 $ a 1.499 $) | Porcentaje del gasto / Contrato anual opaco | Contrato anual opaco + porcentaje del gasto | Contrato anual opaco |
| Asignación de Kubernetes | Incluido sin coste adicional (0 $) | Incluido en el contrato anual | +25% de tarifa adicional | Incluido en el nivel Enterprise |
| Coste de Unit Economics | Incluido sin coste adicional (0 $) | Incluido en el contrato anual | +250-500 $/mes adicional | Incluido en el nivel Enterprise |
| Ejecución práctica | Sí (8 horas SRE/mes en Scale) | No (solo recomendaciones de software) | No (solo recomendaciones de software) | No (solo recomendaciones de software) |
| Frecuencia de actualización de datos | 6 horas | De 12 a 24 horas | De 12 a 24 horas | De 24 a 48 horas |
| Despliegue soberano BYOC | Sí (despliegue privado en AWS VPC disponible) | No (solo SaaS alojado en EE. UU.) | No (solo SaaS alojado en EE. UU.) | No (solo SaaS alojado en EE. UU.) |
Al reemplazar las plataformas heredadas por CostGlass, las organizaciones eliminan el "impuesto sobre la nube" aplicado a su crecimiento, al tiempo que obtienen ejecución de ingeniería práctica para implementar ahorros reales, en lugar de limitarse a añadir tareas a un backlog desatendido de Jira.
Cómo configurar showback y chargeback en CostGlass
Establecer una matriz de asignación de costes automatizada y lista para la junta directiva en CostGlass requiere menos de 30 minutos:
Paso 1: Conectar sus cuentas multi-cloud y SaaS
Despliegue un rol IAM de solo lectura en sus cuentas de AWS, Azure, GCP o SaaS. Para AWS, puede usar nuestra plantilla CloudFormation de 1 clic o generar un módulo de Terraform personalizado mediante la guía de conexión de AWS de CostGlass. CostGlass comenzará automáticamente a importar y normalizar sus registros históricos de facturación.
Paso 2: Establecer su jerarquía organizativa
Diríjase a Settings > Org Hierarchy dentro de la consola de CostGlass. Cree su árbol corporativo añadiendo Unidades de Negocio, Departamentos y Equipos. Arrastre y suelte las cuentas de cloud conectadas, suscripciones o proyectos de GCP en sus nodos correspondientes. Para configuraciones avanzadas, consulte la guía de diseño de jerarquía organizativa de CostGlass.
Paso 3: Redactar reglas de Virtual Tagging programáticas
Vaya a FinOps > Virtual Tagging para construir sus reglas de asignación. Puede mapear recursos no etiquetados mediante filtros lógicos (por ejemplo, asignar todos los recursos donde Provider Account sea igual a staging-ecs al QA Team).
{
  "virtual_tag_key": "VTAG:department",
  "rules": [
    {
      "target_value": "Engineering-QA",
      "conditions": {
        "any": [
          { "field": "account_name", "contains": "staging" },
          { "field": "tag:env", "equals": "qa" }
        ]
      }
    }
  ]
}
Obtenga más información sobre la sintaxis lógica en la documentación de Virtual Tagging.
Paso 4: Generar y programar informes para la junta directiva
Abra el Cost Explorer y agrupe sus costes por la etiqueta recién creada VTAG:department. Filtre el gasto no asignado para ver una matriz de showback limpia. Guarde esta vista y prográmela para exportarse automáticamente como un paquete de presentación en Excel (.xlsx) o PDF para su equipo ejecutivo y departamento financiero cada mes utilizando la biblioteca de informes de CostGlass.
Preguntas frecuentes
¿Cómo evita Virtual Tagging provocar desviaciones (drift) en Terraform?
Los métodos de etiquetado tradicionales exigen modificar el código de infraestructura (como Terraform o CloudFormation) para aplicar etiquetas directamente a los recursos cloud en producción. Esto suele provocar conflictos en los archivos de estado, retrasos en los despliegues y desviación en Terraform. Virtual Tagging de CostGlass compila las reglas de asignación en una capa SQL parametrizada sobre sus datos de facturación normalizados. Es totalmente no invasivo y ejecuta mapeos de metadatos virtuales sin modificar sus recursos cloud activos.
¿Podemos asignar costes compartidos de contenedores y data warehouses?
Sí. CostGlass se integra de forma nativa con CNCF OpenCost para analizar métricas de contenedores de EKS, AKS y GKE hasta el nivel de pod, namespace y GPU. Además, nuestra integración con Snowflake rastrea el consumo de créditos de warehouses y el exceso de servicios cloud. Mediante Virtual Tagging, puede unificar los recursos de contenedores y el uso de data warehouses en las mismas asignaciones de unidades de negocio que sus VMs y almacenamiento de objetos tradicionales.
¿Cómo gestiona CostGlass la normalización de nombres de regiones y cuentas multi-cloud?
Los distintos proveedores de nube utilizan convenciones de nomenclatura variadas para las regiones (por ejemplo, AWS usa us-east-1 mientras que Azure usa East US). CostGlass normaliza automáticamente los metadatos regionales, los nombres de cuentas y las categorías de servicio en un esquema estandarizado. Esto le permite consultar y comparar los costes de "Compute" o "Database" en AWS, Azure y GCP de forma simultánea en una vista única y unificada.
¿Listo para eliminar el gasto cloud no etiquetado y establecer matrices de showback auditables? Explore nuestra página de comparación de CostGlass para comprobar cómo superamos a las plataformas tradicionales, revise nuestra guía de Virtual Tagging para dominar la asignación programática o comience su prueba gratuita de 14 días en CostGlass hoy mismo.
Multi-Cloud-Kostenallokation – der Prozess, 100 % der Cloud-, Container- und KI-Ausgaben Geschäftsbereichen zuzuordnen – scheitert regelmäßig an manuellen Legacy-Tags. Durch den Einsatz von programmatischem Virtual Tagging und mandantenfähigen Organisationshierarchien können Finanz- und Engineering-Führungskräfte vorstandstaugliche Showback- und Chargeback-Matrizen etablieren. CostGlass automatisiert diese Zuordnung im Rahmen eines Pauschalpreismodells und beseitigt Reibungsverluste bei der Tag-Compliance vollständig.
Die strategische Notwendigkeit der Multi-Cloud-Kostenallokation
Für moderne Technologieunternehmen, die über mehrere Cloud-Anbieter, Container-Orchestrierungsplattformen und SaaS-Tools hinweg arbeiten, stellen Cloud-Ausgaben selten einen einzelnen Posten dar. Stattdessen handelt es sich um ein komplexes, dynamisches Geflecht aus Infrastruktur, Datenbanken, Datenplattformen von Drittanbietern und APIs für Large Language Models (LLMs).
Ohne ein solides Allokations-Framework können Finanz- und Engineering-Verantwortliche fundamentale Geschäftsfragen nicht beantworten:
- Wie hoch ist die exakte Bruttomarge unseres primären SaaS-Produkts?
- Welche Kundenkonten schmälern unsere Rentabilität aufgrund nicht zugeordneter Datenbank- oder API-Transaktionen?
- Wie sollten wir gemeinsame Infrastrukturkosten – wie Netzwerktransfer, NAT Gateways und ungenutzte Kubernetes-Kapazitäten – zwischen den Entwicklungsabteilungen aufteilen?
Um dieses Problem zu lösen, implementieren Unternehmen zwei zentrale Methoden der finanziellen Governance:
- Showback: Bereitstellung täglicher Kostentransparenz für Entwicklungsteams und Geschäftsbereiche, Etablierung finanzieller Verantwortung und Erkennung von Anomalien, ohne interne Budgettransfers auszuführen.
- Chargeback: Erstellung hauptbuchgestützter, prüfungsfähiger Finanzberichte, die interne Budgets von Geschäftsbereichen direkt belasten oder Kosten für die Unternehmensbuchhaltung direkt den Umsatzkosten (COGS) zuordnen.
Die providerübergreifende Implementierung dieser Methoden über AWS, Azure, GCP, Kubernetes, Snowflake und OpenAI hinweg ist historisch jedoch extrem schwierig. Geteilte Ressourcen schaffen eine „Blackbox“ nicht zugewiesener Ausgaben, die die wahren Unit Economics verschleiert.
Warum herkömmliche Tagging-Strategien scheitern: Die Realität von „Build vs. Buy“
In der Vergangenheit versuchten Platform Engineers, die Kostenallokation dadurch zu lösen, dass sie Entwickler zwangen, jede Ressource in Terraform oder CloudFormation manuell zu taggen. Dieser Ansatz scheitert im Produktivbetrieb aus mehreren strukturellen Gründen:
- Nicht unterstützte Ressourcen: Nicht alle Cloud-Ressourcen unterstützen Tagging. Netzwerkschnittstellen, IP-Adressen und bestimmte serverlose Komponenten können keine Metadaten tragen.
- Menschliche Fehler und Schema-Drift: Im Laufe der Zeit weichen Tag-Schlüssel voneinander ab. Ein einzelner Tag-Schlüssel, der als
Environment,envoderenvironmentgepflegt wird, spaltet Abrechnungsdaten in drei getrennte Silos auf. - Rückwirkende Änderungen sind unmöglich: Wenn eine Ressource sechs Monate lang nicht oder falsch getaggt war, ändert die Aktualisierung des Ressourcen-Tags in AWS heute nichts an den historischen Abrechnungsdatensätzen in Ihrem Cost and Usage Report (CUR).
Die wirtschaftlichen Aspekte von „Build vs. Buy“ im Engineering
Angesichts dieser Einschränkungen versuchen einige Engineering-Teams, eine eigene interne Pipeline zur Kostennormalisierung und -allokation aufzubauen. Sie schreiben benutzerdefinierte ETL-Skripte zur Erfassung von AWS CUR 2.0-Dateien, Azure MCA-Exporten und GCP BigQuery-Datasets und versuchen, diese Datensätze zu parsen, zu bereinigen und in eine einheitliche Datenbank zu überführen.
Dieser DIY-Ansatz ist eine massive Engineering- und Wartungsfalle:
- Fragile Abrechnungsschemata: Cloud-Anbieter aktualisieren ihre Abrechnungsexportformate regelmäßig. Eine einzige Schemaänderung kann interne Pipelines lahmlegen und zu fehlerhaften Finanzberichten führen.
- Hohe Personalkosten: Der Aufbau und die Wartung einer individuellen Multi-Cloud-Kostenpipeline erfordert kontinuierlichen Einsatz von Senior Data Engineers und SREs. Dadurch werden Engineering-Ressourcen von der Entwicklung umsatzgenerierender Produktfunktionen abgezogen, was Personalkosten von über 100.000 $/Jahr allein für die Pflege eines anfälligen internen Dashboards verursacht.
- Latenzprobleme: DIY-Pipelines erreichen selten Echtzeittransparenz und laufen oft mit einer Verzögerung von 24 bis 48 Stunden, wodurch kritische Kostenspitzen übersehen werden.
Anstatt Engineering-Kapital für benutzerdefinierte Pipelines zu verschwenden, entscheiden sich skalierende Unternehmen für CostGlass. CostGlass konsolidiert 13 native Multi-Cloud-, Kubernetes- und KI-Konnektoren in einem einzigen, normalisierten Ledger, der alle 6 Stunden aktualisiert wird. So können Teams rückwirkende, programmatische Allokationsregeln implementieren, ohne ein einziges Cloud-Tag manipulieren zu müssen.
Konzeption vorstandstauglicher Showback- und Chargeback-Matrizen
Um ein revisionssicheres Finanz-Framework aufzubauen, müssen Plattform- und Finanzteams vom manuellen Tagging zur programmatischen Allokation übergehen. Dies gelingt über eine strukturierte Methodik in vier Schritten:
Schritt 1: Definieren der Organisationshierarchie
Bevor Sie Kosten zuweisen, müssen Sie die Zielstruktur Ihres Unternehmens definieren. Bilden Sie AWS-Konten, Azure-Abonnements, GCP-Projekte und SaaS-Konnektoren in einem mehrstufigen Baum aus Geschäftsbereichen, Abteilungen und Teams ab.
Dadurch wird sichergestellt, dass alle Kosten, die einem untergeordneten Knoten zugewiesen sind, automatisch auf übergeordnete Einheiten hochgerechnet werden. Das schafft eine lückenlose Nachverfolgbarkeit von der Sandbox einzelner Entwickler bis hin zur Gewinn- und Verlustrechnung des Unternehmens.
Schritt 2: Trennen von direkten und geteilten Kosten
Nicht alle Cloud-Kosten sind gleich. Ihr Allokationsmodell muss strikt unterscheiden zwischen:
- Direkten Kosten: Ressourcen, die einem einzelnen Produkt, einer Umgebung oder einem Kunden fest zugeordnet sind (z. B. eine AWS RDS-Instanz, die mit einer bestimmten Kunden-ID gekennzeichnet ist).
- Geteilten Kosten: Infrastruktur, die mehrere Geschäftsbereiche unterstützt (z. B. AWS NAT Gateways, gemeinsam genutzte Kubernetes-Cluster, Snowflake Data Warehouses oder zentrale Datadog-Logging-Umgebungen).
Schritt 3: Programmatische Allokation über Virtual Tagging
Anstatt sich darauf zu verlassen, dass Entwickler Ressourcen taggen, nutzen Sie Virtual Tagging, um komplexe logische Regeln auf der Plattformebene auszuwerten. Virtual Tagging kompiliert verschachtelte boolesche Gruppen, reguläre Ausdrücke und Wertezuordnungen in eine parametrisierte Abfrage über Ihr vereinheitlichtes Abrechnungs-Ledger.
Wenn beispielsweise eine nicht getaggte EC2-Instanz zu einem AWS-Konto namens prod-billing-service gehört, kann eine Virtual-Tag-Regel 100 % ihrer Kosten automatisch der Abteilung „Billing Department“ unter dem Geschäftsbereich „Core Platform“ zuweisen. Diese Zuweisung greift rückwirkend und bereinigt historische Daten sofort, ohne einen Terraform-Drift zu verursachen.
Schritt 4: Verteilen von ungenutzten Kapazitäten und Gemeinkosten
Geteilte Kosten müssen anhand gerechter Verteilungsregeln umgelegt werden:
- Pro-Rata-Verteilung: Umlage von geteilten Netzwerktransfer- oder Support-Kosten proportional zu den direkten Ausgaben der jeweiligen Abteilung.
- Gleichmäßige Aufteilung: Gleichmäßige Verteilung allgemeiner Plattform-Gemeinkosten auf alle aktiven Engineering-Teams.
- Ungenutzte Kubernetes-Kapazität: Rückzuordnung nicht zugewiesener Node-Kapazität an die Namespaces und Pods, die das Scale-Out der Nodes verursacht haben, um echte Kostenverantwortung bei Containern zu gewährleisten.
Executive ROI: Warum CostGlass traditionelle Plattformen übertrifft
Bei der Evaluierung von Multi-Cloud-Kostenallokationstools vergleichen Führungskräfte CostGlass häufig mit herkömmlichen Plattformen wie CloudZero, Vantage, Finout und IBM Cloudability. Etablierte Tools nutzen oft undurchsichtige, unvorteilhafte Preismodelle, die einen prozentualen Anteil Ihrer Cloud-Ausgaben oder Einsparungen verlangen, was Ihre Engineering-Effizienz faktisch bestraft.
CostGlass basiert auf einem transparenten, planbaren Modell mit monatlichen Pauschalpreisen und monatlicher Abrechnung. So behalten Sie 100 % jedes eingesparten Betrags:
- Free: 0 $ (bis zu 5.000 £/Monat Cloud-Ausgabenlimit)
- Starter: 99 $/Monat (bis zu 15.000 £/Monat Cloud-Ausgabenlimit)
- Growth: 499 $/Monat (bis zu 50.000 £/Monat Cloud-Ausgabenlimit)
- Scale: 1.499 $/Monat (bis zu 100.000 £/Monat Cloud-Ausgabenlimit; beinhaltet 8 dedizierte Arbeitsstunden von Senior DevOps/FinOps Engineers pro Monat, um Terraform-PRs zu schreiben, Instanzen zu optimieren und Einsparmaßnahmen operativ umzusetzen)
- Enterprise: Individuelle Preisgestaltung (> 100.000 £/Monat Cloud-Ausgabenlimit; beinhaltet ein privates AWS BYOC-Deployment im eigenen Account)
| Funktion / Leistungsmerkmal | CostGlass | CloudZero | Finout | IBM Cloudability |
|---|---|---|---|---|
| Preismodell | Planbare monatliche Pauschale (0 $ bis 1.499 $) | Anteil an den Ausgaben / Undurchsichtiger Jahresvertrag | Undurchsichtiger Jahresvertrag + prozentualer Anteil | Undurchsichtiger Jahresvertrag |
| Kubernetes-Allokation | Inklusive ohne Aufpreis | Im Jahresvertrag enthalten | +25 % Zusatzgebühr | In der Enterprise-Stufe enthalten |
| Unit Economics Tracking | Inklusive ohne Aufpreis | Im Jahresvertrag enthalten | +250–500 $/Monat extra | In der Enterprise-Stufe enthalten |
| Operative Umsetzung | Ja (8 SRE-Stunden/Monat im Scale-Tarif) | Nein (nur Software-Empfehlungen) | Nein (nur Software-Empfehlungen) | Nein (nur Software-Empfehlungen) |
| Datenaktualisierungsrate | 6 Stunden | 12 bis 24 Stunden | 12 bis 24 Stunden | 24 bis 48 Stunden |
| Souveränes BYOC-Deployment | Ja (Private AWS VPC-Bereitstellung verfügbar) | Nein (nur US-gehostetes SaaS) | Nein (nur US-gehostetes SaaS) | Nein (nur US-gehostetes SaaS) |
Durch den Wechsel von Altsystemen zu CostGlass eliminieren Unternehmen die „Cloud-Steuer“ auf ihr Wachstum und erhalten gleichzeitig direkte Engineering-Unterstützung, um Einsparungen tatsächlich umzusetzen, anstatt lediglich Tickets in einem unbearbeiteten Jira-Backlog zu sammeln.
So konfigurieren Sie Showback und Chargeback in CostGlass
Die Einrichtung einer automatisierten, vorstandstauglichen Kostenallokationsmatrix in CostGlass dauert weniger als 30 Minuten:
Schritt 1: Verbinden Sie Ihre Multi-Cloud- und SaaS-Konten
Rollen Sie eine schreibgeschützte IAM-Rolle in Ihren AWS-, Azure-, GCP- oder SaaS-Konten aus. Für AWS können Sie unsere 1-Klick-CloudFormation-Vorlage verwenden oder ein individuelles Terraform-Modul mithilfe des CostGlass AWS Connection Guide generieren. CostGlass beginnt automatisch mit dem Import und der Normalisierung Ihrer historischen Abrechnungsdaten.
Schritt 2: Etablieren Sie Ihre Organisationshierarchie
Navigieren Sie in der CostGlass-Konsole zu Settings > Org Hierarchy. Erstellen Sie Ihren Unternehmensbaum durch das Hinzufügen von Geschäftsbereichen, Abteilungen und Teams. Ziehen Sie verbundene Cloud-Konten, Abonnements oder GCP-Projekte per Drag-and-Drop in die jeweiligen Knoten. Für fortgeschrittene Setups konsultieren Sie den CostGlass Org Hierarchy Design Guide.
Schritt 3: Definieren Sie programmatische Virtual-Tag-Regeln
Navigieren Sie zu FinOps > Virtual Tagging, um Ihre Allokationsregeln zu erstellen. Sie können nicht getaggte Ressourcen über logische Filter zuordnen (z. B. alle Ressourcen, bei denen Provider Account den Wert staging-ecs hat, dem QA Team zuweisen).
{
  "virtual_tag_key": "VTAG:department",
  "rules": [
    {
      "target_value": "Engineering-QA",
      "conditions": {
        "any": [
          { "field": "account_name", "contains": "staging" },
          { "field": "tag:env", "equals": "qa" }
        ]
      }
    }
  ]
}
Erfahren Sie mehr über die logische Syntax in der Virtual Tagging Documentation.
Schritt 4: Erstellen und Planen vorstandstauglicher Berichte
Öffnen Sie den Cost Explorer und gruppieren Sie Ihre Ausgaben nach Ihrem neu erstellten Tag VTAG:department. Filtern Sie nicht zugeordnete Ausgaben heraus, um Ihre bereinigte Showback-Matrix einzusehen. Speichern Sie diese Ansicht und planen Sie den automatischen monatlichen Export als Excel- (.xlsx) oder PDF-Vorstandsbericht für Ihr Führungsteam und Ihre Finanzabteilung mithilfe der CostGlass Reports Library.
Häufig gestellte Fragen
Wie verhindert Virtual Tagging einen Terraform-Drift?
Traditionelle Tagging-Methoden erfordern Änderungen an Ihrem Infrastruktur-Code (wie Terraform oder CloudFormation), um Tags direkt auf aktiven Cloud-Ressourcen anzuwenden. Dies führt häufig zu State-File-Konflikten, Verzögerungen beim Deployment und Terraform-Drift. CostGlass Virtual Tagging kompiliert Allokationsregeln in eine parametrisierte SQL-Schicht über Ihren normalisierten Abrechnungsdaten. Dies geschieht vollständig non-intrusiv und führt virtuelle Metadatenzuordnungen aus, ohne Ihre aktiven Cloud-Ressourcen zu verändern.
Können wir geteilte Container- und Data-Warehouse-Kosten allokieren?
Ja. CostGlass integriert sich nativ mit CNCF OpenCost, um EKS-, AKS- und GKE-Containermetriken bis auf Pod-, Namespace- und GPU-Ebene aufzuschlüsseln. Darüber hinaus erfasst unsere Snowflake-Integration den Warehouse-Credit-Verbrauch und Überlastungsgebühren von Cloud-Diensten. Über Virtual Tagging können Sie Container-Ressourcen und Data-Warehouse-Nutzung denselben Geschäftsbereichszuordnungen hinzufügen wie Ihre herkömmlichen Cloud-VMs und den Objektspeicher.
Wie handhabt CostGlass die Normalisierung von Multi-Cloud-Regionen und Kontonamen?
Verschiedene Cloud-Anbieter verwenden unterschiedliche Namenskonventionen für Regionen (z. B. nutzt AWS us-east-1, während Azure East US verwendet). CostGlass normalisiert regionale Metadaten, Kontonamen und Servicekategorien automatisch in ein einheitliches Schema. So können Sie Kosten für „Compute“ oder „Database“ über AWS, Azure und GCP hinweg direkt in einer konsolidierten Ansicht vergleichen.
Sind Sie bereit, ungetaggte Cloud-Verschwendung zu stoppen und revisionssichere Showback-Matrizen aufzubauen? Entdecken Sie unsere CostGlass Vergleichsseite, um zu sehen, warum wir herkömmliche Plattformen übertreffen, lesen Sie unseren Virtual Tagging Guide, um die programmatische Allokation zu meistern, oder starten Sie Ihre 14-tägige kostenlose Testversion auf CostGlass noch heute.
L'allocation des coûts multi-cloud — le processus consistant à attribuer 100 % des dépenses cloud, conteneurs et IA aux unités commerciales — échoue lorsqu'elle repose sur des balises manuelles héritées. En exploitant le Virtual Tagging programmatique et des hiérarchies organisationnelles mutualisées, les responsables financiers et techniques peuvent concevoir des matrices de showback et de chargeback prêtes pour le conseil d'administration. CostGlass automatise cette allocation via un modèle tarifaire forfaitaire, éliminant intégralement les frictions de conformité liées au balisage manuel.
L'impératif stratégique de l'allocation des coûts multi-cloud
Pour les entreprises technologiques modernes opérant sur plusieurs fournisseurs de cloud, plateformes d'orchestration de conteneurs et outils SaaS, les dépenses cloud représentent rarement une simple ligne budgétaire. Il s'agit plutôt d'un maillage complexe et dynamique d'infrastructures, de bases de données, de plateformes de données tierces et d'API de grands modèles linguistiques (LLM).
Sans un cadre d'allocation robuste, les directeurs financiers et les responsables de l'ingénierie ne peuvent pas répondre aux questions fondamentales de leur activité :
- Quelle est la marge brute exacte de notre produit SaaS principal ?
- Quels comptes clients érodent notre rentabilité en raison de transactions de bases de données ou d'appels API non alloués ?
- Comment devons-nous répartir les coûts d'infrastructure partagés — tels que le transit réseau, les passerelles NAT Gateways et la capacité inactive de Kubernetes — entre les départements d'ingénierie ?
Pour résoudre ce défi, les organisations mettent en œuvre deux méthodologies principales de gouvernance financière :
- Showback : Fournir aux équipes d'ingénierie et aux unités opérationnelles une visibilité quotidienne des coûts, instaurer une responsabilité financière et détecter les anomalies sans effectuer de virements budgétaires internes.
- Chargeback : Générer des rapports financiers vérifiables et adossés au grand livre qui débitent directement les budgets des unités opérationnelles internes ou affectent les coûts directement au coût des marchandises vendues (COGS) pour la comptabilité d'entreprise.
Cependant, déployer ces méthodologies sur AWS, Azure, GCP, Kubernetes, Snowflake et OpenAI s'avère historiquement difficile. Les ressources partagées créent une « boîte noire » de dépenses non allouées qui masque les véritables unit economics.
Pourquoi les stratégies de balisage traditionnelles échouent : la réalité du « Build vs. Buy »
Historiquement, les ingénieurs de plateforme ont tenté de résoudre l'allocation des coûts en contraignant les développeurs à étiqueter manuellement chaque ressource dans Terraform ou CloudFormation. Cette approche échoue à l'échelle pour plusieurs raisons structurelles :
- Ressources non compatibles : Toutes les ressources cloud ne prennent pas en charge le balisage. Les interfaces réseau, les adresses IP et certains composants serverless ne peuvent pas porter de métadonnées.
- Erreur humaine et dérive de schéma : Au fil du temps, les clés de balises divergent. Une même clé représentée sous la forme
Environment,envouenvironmentdivise les données de facturation en trois silos distincts. - Rétroactivité impossible : Si une ressource est restée sans étiquette ou mal étiquetée pendant six mois, modifier sa balise dans AWS aujourd'hui ne corrigera pas les enregistrements de facturation historiques dans votre rapport Cost and Usage Report (CUR).
L'économie d'ingénierie du « Développer ou Acheter »
Confrontées à ces limites, certaines équipes d'ingénierie tentent de développer en interne leur propre pipeline de normalisation et d'allocation des coûts. Elles écrivent des scripts ETL personnalisés pour ingérer les fichiers AWS CUR 2.0, les exports Azure MCA et les jeux de données GCP BigQuery, dans l'espoir d'analyser, nettoyer et mapper ces enregistrements au sein d'une base de données unifiée.
Cette voie du « fait maison » représente un piège massif d'ingénierie et de maintenance :
- Schémas de facturation instables : Les fournisseurs de cloud mettent fréquemment à jour leurs formats d'export de facturation. Une simple modification de schéma peut briser les pipelines internes, corrompant ainsi le reporting financier.
- Coûts salariaux élevés : Construire et maintenir un pipeline de coûts multi-cloud personnalisé exige l'implication continue d'ingénieurs de données seniors et de SRE. Cela détourne les ressources d'ingénierie du développement de fonctionnalités génératrices de revenus, coûtant plus de 100 000 $/an en frais de masse salariale simplement pour maintenir un tableau de bord interne fragile.
- Problèmes de latence : Les pipelines développés en interne atteignent rarement une visibilité en temps réel, fonctionnant souvent avec un décalage de 24 à 48 heures qui empêche de détecter les pics de coûts critiques.
Au lieu de gaspiller du capital d'ingénierie dans des pipelines sur mesure, les organisations en pleine croissance choisissent CostGlass. CostGlass unifie 13 connecteurs natifs multi-cloud, Kubernetes et IA au sein d'un grand livre unique et normalisé qui s'actualise toutes les 6 heures, permettant aux équipes de déployer des règles d'allocation programmatiques et rétroactives sans modifier la moindre balise cloud.
Concevoir des matrices de showback et chargeback prêtes pour le conseil d'administration
Pour mettre en place un cadre financier prêt pour l'audit, les équipes de plateforme et de finance doivent passer du balisage manuel à l'allocation programmatique. Cela repose sur une méthodologie structurée en quatre étapes :
Étape 1 : Définir la hiérarchie organisationnelle
Avant d'allouer les coûts, vous devez définir la structure cible de votre entreprise. Mappez les comptes AWS, les abonnements Azure, les projets GCP et les connecteurs SaaS au sein d'une arborescence multi-niveaux d'unités commerciales, de départements et d'équipes.
Cela garantit que tout coût attribué à un nœud terminal remonte automatiquement aux entités parentes, établissant une traçabilité directe depuis les bacs à sable individuels des développeurs jusqu'au compte de résultat (P&L) de l'entreprise.
Étape 2 : Isoler les coûts directs des coûts partagés
Tous les coûts cloud ne sont pas identiques. Votre modèle d'allocation doit séparer :
- Coûts directs : Ressources dédiées à un seul produit, environnement ou client (par exemple, une instance AWS RDS étiquetée avec un identifiant client spécifique).
- Coûts partagés : Infrastructures qui soutiennent plusieurs unités commerciales (par exemple, les passerelles AWS NAT Gateways, les clusters Kubernetes partagés, les entrepôts de données Snowflake ou les environnements centralisés de journalisation Datadog).
Étape 3 : Allocation programmatique via le Virtual Tagging
Plutôt que de compter sur les développeurs pour étiqueter les ressources, utilisez le Virtual Tagging pour évaluer des règles logiques complexes au niveau de la plateforme. Le Virtual Tagging compile des groupes booléens imbriqués, des expressions régulières et des correspondances de valeurs en une requête paramétrée exécutée sur votre grand livre de facturation unifié.
Par exemple, si une instance EC2 non étiquetée appartient à un compte AWS nommé prod-billing-service, une règle de Virtual Tagging peut attribuer automatiquement 100 % de son coût au « Département Facturation » sous l'unité commerciale « Plateforme Centrale ». Cette allocation est rétroactive et nettoie instantanément les données historiques sans provoquer de dérive de configuration Terraform.
Étape 4 : Répartir la capacité inactive et les frais généraux communs
Les coûts partagés doivent être distribués à l'aide de règles d'allocation équitables :
- Distribution au prorata : Allouer le transit réseau partagé ou les coûts de support proportionnellement aux dépenses directes de chaque département.
- Répartition égale : Diviser les frais généraux communs de la plateforme à parts égales entre les équipes d'ingénierie actives.
- Capacité inactive Kubernetes : Allouer la capacité de nœud non attribuée aux espaces de noms (namespaces) et aux pods qui ont provoqué le dimensionnement automatique des nœuds, garantissant une véritable responsabilisation des coûts de conteneurs.
ROI exécutif : Pourquoi CostGlass surpasse les plateformes historiques
Lors de l'évaluation des outils d'allocation des coûts multi-cloud, les dirigeants comparent souvent CostGlass à des plateformes traditionnelles telles que CloudZero, Vantage, Finout et IBM Cloudability. Les outils historiques introduisent souvent des modèles de tarification opaques et abusifs qui facturent un pourcentage de vos dépenses ou de vos économies cloud, pénalisant ainsi votre efficacité d'ingénierie.
CostGlass fonctionne selon un modèle de tarification mensuelle forfaitaire prévisible et transparent avec une facturation mensuelle sans engagement, garantissant que vous conservez 100 % de chaque dollar économisé :
- Free : 0 $ (plafond de dépenses cloud jusqu'à 5 000 £/mois)
- Starter : 99 $/mois (plafond de dépenses cloud jusqu'à 15 000 £/mois)
- Growth : 499 $/mois (plafond de dépenses cloud jusqu'à 50 000 £/mois)
- Scale : 1 499 $/mois (plafond de dépenses cloud jusqu'à 100 000 £/mois ; comprend 8 heures dédiées d'ingénieur DevOps/FinOps senior chaque mois pour rédiger des pull requests Terraform, redimensionner les instances et exécuter les optimisations)
- Enterprise : Tarification sur mesure (plafond de dépenses cloud > 100 000 £/mois ; inclut un déploiement privé en mode BYOC au sein de votre propre compte AWS)
| Fonctionnalité / Capacité | CostGlass | CloudZero | Finout | IBM Cloudability |
|---|---|---|---|---|
| Modèle tarifaire | Forfait mensuel prévisible (de 0 $ à 1 499 $) | Pourcentage des dépenses / Contrat annuel opaque | Contrat annuel opaque + pourcentage des dépenses | Contrat annuel opaque |
| Allocation Kubernetes | Incluse sans surcoût (0 $) | Incluse dans le contrat annuel | Option facturée +25 % | Incluse dans l'offre Enterprise |
| Coût par Unit Economics | Inclus sans surcoût (0 $) | Inclus dans le contrat annuel | Option facturée +250 $ à 500 $/mois | Inclus dans l'offre Enterprise |
| Exécution technique concrète | Oui (8 heures SRE/mois sur Scale) | Non (recommandations logicielles uniquement) | Non (recommandations logicielles uniquement) | Non (recommandations logicielles uniquement) |
| Fréquence d'actualisation | 6 heures | 12 à 24 heures | 12 à 24 heures | 24 à 48 heures |
| Déploiement souverain BYOC | Oui (Déploiement en VPC AWS privé disponible) | Non (SaaS hébergé aux États-Unis uniquement) | Non (SaaS hébergé aux États-Unis uniquement) | Non (SaaS hébergé aux États-Unis uniquement) |
En remplaçant les plateformes héritées par CostGlass, les entreprises suppriment la « taxe cloud » prélevée sur leur croissance tout en bénéficiant d'une exécution technique concrète pour concrétiser les économies, plutôt que de simplement accumuler des tâches non traitées dans un backlog Jira.
Comment configurer le showback et le chargeback dans CostGlass
La mise en place d'une matrice d'allocation des coûts automatisée et prête pour le conseil d'administration dans CostGlass prend moins de 30 minutes :
Étape 1 : Connectez vos comptes multi-cloud et SaaS
Déployez un rôle IAM en lecture seule sur vos comptes AWS, Azure, GCP ou SaaS. Pour AWS, vous pouvez utiliser notre modèle CloudFormation en 1 clic ou générer un module Terraform personnalisé en suivant le guide de connexion AWS de CostGlass. CostGlass commencera automatiquement à importer et normaliser vos enregistrements de facturation historiques.
Étape 2 : Établissez votre hiérarchie organisationnelle
Accédez à Settings > Org Hierarchy dans la console CostGlass. Créez votre arborescence d'entreprise en ajoutant des unités commerciales, des départements et des équipes. Glissez-déposez les comptes cloud connectés, les abonnements ou les projets GCP dans leurs nœuds respectifs. Pour les configurations avancées, consultez le guide de conception de hiérarchie organisationnelle de CostGlass.
Étape 3 : Rédigez des règles programmatiques de Virtual Tagging
Accédez à FinOps > Virtual Tagging pour élaborer vos règles d'allocation. Vous pouvez mapper les ressources sans balises à l'aide de filtres logiques (par exemple, mapper toutes les ressources dont le champ Provider Account est égal à staging-ecs vers l'équipe QA Team).
{
  "virtual_tag_key": "VTAG:department",
  "rules": [
    {
      "target_value": "Engineering-QA",
      "conditions": {
        "any": [
          { "field": "account_name", "contains": "staging" },
          { "field": "tag:env", "equals": "qa" }
        ]
      }
    }
  ]
}
Apprenez-en davantage sur la syntaxe logique dans la documentation sur le Virtual Tagging.
Étape 4 : Générez et planifiez des rapports prêts pour la direction
Ouvrez le Cost Explorer et regroupez vos coûts selon votre nouvelle balise VTAG:department. Filtrez les dépenses non allouées pour visualiser votre matrice de showback épurée. Enregistrez cette vue et planifiez son exportation automatique sous forme de classeur Excel (.xlsx) ou de dossier PDF pour votre équipe dirigeante et votre direction financière chaque mois grâce à la bibliothèque de rapports CostGlass.
Foire aux questions
Comment le Virtual Tagging évite-t-il la dérive Terraform ?
Les méthodes de balisage traditionnelles vous obligent à modifier votre code d'infrastructure (comme Terraform ou CloudFormation) pour appliquer directement des balises aux ressources cloud en production. Cela entraîne souvent des conflits de fichiers d'état, des retards de déploiement et une dérive d'état Terraform. Le Virtual Tagging de CostGlass compile les règles d'allocation sous forme de couche SQL paramétrée au-dessus de vos données de facturation normalisées. La méthode est totalement non intrusive et applique les correspondances de métadonnées virtuelles sans modifier vos ressources cloud en direct.
Pouvons-nous allouer les coûts partagés des conteneurs et des entrepôts de données ?
Oui. CostGlass s'intègre nativement à CNCF OpenCost pour analyser les métriques de conteneurs EKS, AKS et GKE jusqu'au niveau du pod, de l'espace de noms (namespace) et du GPU. De plus, notre intégration Snowflake suit la consommation de crédits des entrepôts et les dépassements de services cloud. Grâce au Virtual Tagging, vous pouvez regrouper les ressources de conteneurs et l'utilisation des entrepôts de données dans les mêmes allocations d'unités commerciales que vos machines virtuelles et votre stockage objet standards.
Comment CostGlass gère-t-il la normalisation des régions et des noms de comptes multi-cloud ?
Les différents fournisseurs de cloud utilisent des conventions de nommage variées pour les régions (par exemple, AWS utilise us-east-1 tandis qu'Azure utilise East US). CostGlass normalise automatiquement les métadonnées régionales, les noms de comptes et les catégories de services au sein d'un schéma standardisé. Cela vous permet d'interroger et de comparer côte à côte les coûts de calcul (« Compute ») ou de base de données (« Database ») sur AWS, Azure et GCP dans une vue unifiée unique.
Prêt à éliminer le gaspillage cloud non étiqueté et à établir des matrices de showback prêtes pour l'audit ? Explorez notre page de comparaison CostGlass pour voir comment nous surpassons les plateformes historiques, consultez notre guide du Virtual Tagging pour maîtriser l'allocation programmatique, ou démarrez votre essai gratuit de 14 jours sur CostGlass dès aujourd'hui.
Ready to unify your multi-cloud costs?
See your AWS, Azure, GCP, and Kubernetes spend in canonical FOCUS 1.0 in under 15 minutes.