Anomaly detection
How CostGlass finds unusual daily cost, how to tune it, explain it and be notified.
Anomaly detection
CostGlass watches each service's daily cost, flags days that are clearly out of line with its own recent history, and can tell the right people straight away.
- An anomaly is a day when a service cost clearly more than it normally does, allowing for its usual weekday pattern.
- Detection runs automatically every 6 hours on stored daily cost, and on demand with the scan button.
- A day is flagged only when it clears three tests at once: how unusual it is, a minimum extra amount per day, and a minimum percentage rise.
- Every anomaly has a severity (medium, high or critical), a status you control, and an Explanation that is either measured facts or written by CostGlass AI.
- Notification rules by threshold decide who is told: by extra dollars per day or by percentage, per cloud and service, with quiet hours, muting and daily digests.
What an anomaly is, and what it is not
Cloud spend goes up and down for good reasons: a busy weekday, a monthly job, a launch. An anomaly is not "spend went up". It is "spend went up more than this service's own recent history explains". That is why a service that always costs a lot on Mondays is not flagged every Monday.
Anomaly detection is different from budgets (a ceiling you choose) and cost alerts (a rise versus the previous period). It looks at one day at a time and compares it with that service's own normal.
How detection works
Which data it uses
- It reads daily cost stored for every connected cloud, AI or SaaS vendor. Each combination of cloud, service and account is its own series.
- A cloud that reports only monthly totals cannot be scanned, because a day is the smallest unit. The scan result lists such clouds as Skipped clouds with the reason.
- Credits and refunds are left out, so a credit running out never looks like a spike and a credit never hides a real one. Placeholder rows such as month-to-date totals are left out too.
- A series needs at least 7 days of history before it can be judged.
What counts as expected
For each day under test, CostGlass works out what that day should have cost:
- Take the average of the previous 7 days. This is the rolling baseline.
- Adjust it for the day of the week. Over the last 90 days it compares each weekday with the overall average (it needs at least 3 samples of that weekday, and the adjustment is limited to between half and double).
- The result is the expected cost for that day.
How unusual is the day
The z-score is a measure of how many "normal swings" a day is above expected. A z-score of 3 means about three typical swings above expected. A swing is the day-to-day variation in that series, measured over the last week and the last 90 days, whichever is larger, with a small floor so that an ultra-calm week does not turn ordinary noise into a spike. If a series has been perfectly flat and a real new cost appears, that is itself treated as a strong signal.
The three tests
A day is flagged only when all three are true:
- Its z-score is at least the Sensitivity (z-threshold).
- It cost more than the Minimum daily increase (USD) above expected.
- It is at least the Minimum increase (%) above expected.
The money and percentage floors stop tiny services producing alerts about pennies.
When it runs
- Automatically every 6 hours for every organisation.
- On demand with Run Anomaly Detection Scan at the top of the page.
- The first time you open the page with no anomalies recorded, a scan runs for you.
Each run re-checks the last few days (3 by default), not only yesterday, because cloud providers often post charges late. An anomaly is recorded once per cloud, service, account and day, and updated if a later scan changes its numbers.
A storage service normally costs about 20 a day, and a bit more on weekdays. On a Wednesday it costs 80. The weekday-adjusted expectation is about 22, so the day is 58 above expected and about 260% over. That clears the default floors, and the unusual-ness (z-score) is high, so it is flagged, probably as high. The same service costing 24 on a Wednesday is above average but inside the normal swing, so nothing happens.
Severity
| Severity | When |
|---|---|
| Critical | z-score above 4, or more than 300% above expected. |
| High | z-score above 3, or more than 150% above expected. |
| Medium | Flagged, but below the high bands. |
Detection settings
- Owners and admins can edit. Everyone else can view.
| Setting | What it does | Default and limits |
|---|---|---|
| Sensitivity (z-threshold) | How many normal swings above expected a day must be. Lower catches smaller spikes and gives more false alarms. Higher alerts only on big, clear spikes. | Default 2.5. Allowed 1 to 6. The page labels it very sensitive (under 2), balanced (2 to 3), conservative (3 to 4.5) or very conservative. |
| Minimum daily increase (USD) | Ignore spikes that add less than this per day, however unusual they look. | Default 3. 0 turns the floor off. |
| Minimum increase (%) | Ignore spikes smaller than this percentage above expected. | Default 40. 0 turns the floor off. |
| Days scanned per run (1 to 14) | How many of the most recent days each scan re-checks. | Default 3. |
| Clouds to scan | Which connected clouds and vendors are included. | All connected clouds. |
Reading the Anomalies page
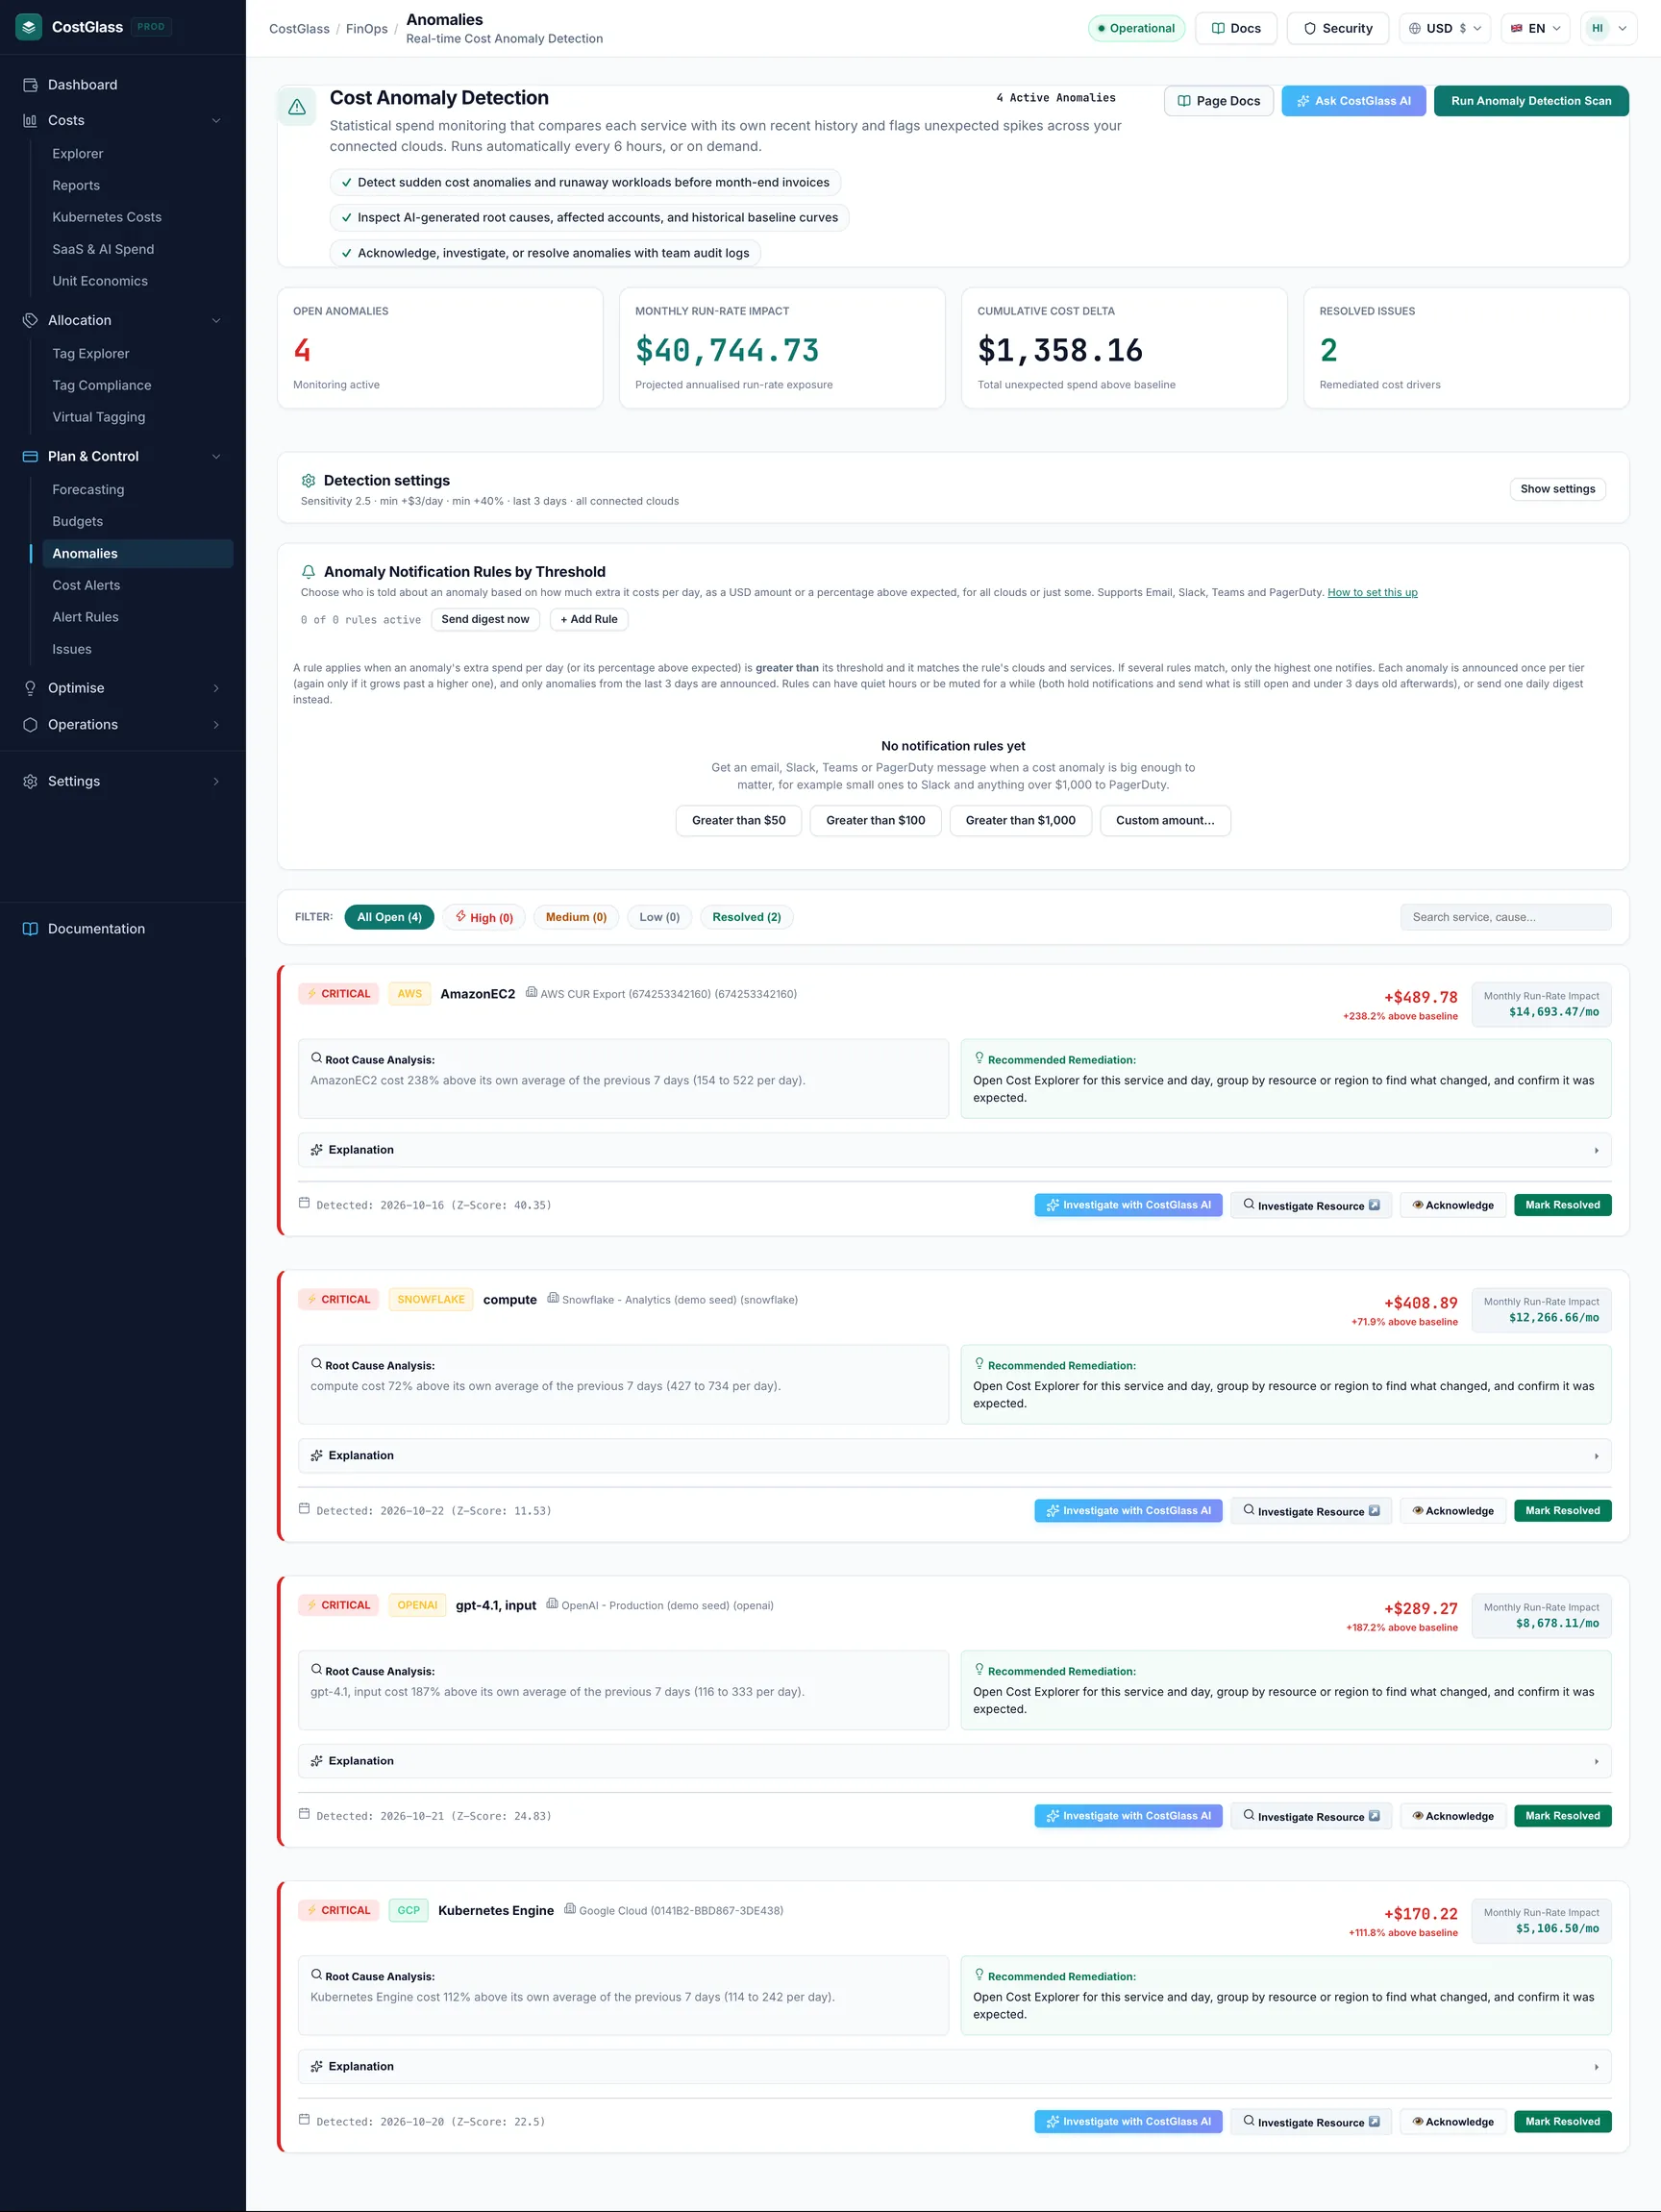
Summary cards
| Card | Meaning |
|---|---|
| Open Anomalies | How many are open, and how many of those are high severity. |
| Monthly Run-Rate Impact | If the extra daily cost carried on for a month: extra per day multiplied by 30, added up across open anomalies. |
| Cumulative Cost Delta | Total unexpected spend above expected across open anomalies. |
| Resolved Issues | How many have been marked resolved. |
Filters
All Open, High, Medium, Low and Resolved, plus a search box (Search service, cause...).
An anomaly card
- A severity badge, a cloud badge, the service name and the account.
- The extra cost and percentage: for example "+1,200, +260% above baseline", plus the Monthly Impact per month.
- Root Cause Analysis and Recommended Remediation. For some AWS services these are pattern-based suggestions from the service name. They are a likely direction, not proof. For other clouds the text states only what was measured.
- The date, and the z-score.
- Affected resources when CostGlass could match some, with an Investigate Resource link.
- The Explanation section (below), and buttons to Investigate with CostGlass AI, Acknowledge and Mark Resolved.
Statuses
| Status | How it is set | What happens next |
|---|---|---|
| Open | A scan found the anomaly. | It counts in the open totals and can trigger notifications. |
| Acknowledged | You click Acknowledge: "I have seen this and someone is on it". | A scan never changes or closes it for you. |
| Resolved | You click Mark Resolved, or a scan finds the day no longer clears the tests. | A resolved anomaly is never reopened by a scan. Use Re-Open if you want it back. |
For anomalies that are not open, the card shows Re-Open.
Explanations: measured facts or CostGlass AI
Open the Explanation section on a card and click Explain this anomaly. There are two kinds.
| Measured facts | CostGlass AI | |
|---|---|---|
| Available on | Every plan. | Scale and Enterprise plans, when AI is enabled for your deployment and your organisation is under its daily limit. |
| How it is made | Worked out from your stored cost data with no AI: expected versus actual, percentage rise, a month run-rate, whether it looks like a one-off spike, a step change or a gradual ramp, and services that rose at the same time. | CostGlass AI is given the same measured facts and writes a short explanation and checks to try. |
| Causes | Only if a known pattern matches, and then marked low confidence. It does not invent causes. | Likely causes with confidence labels and the evidence for each. These are hypotheses. |
| Figures | Computed. | Always computed in code, never written by the AI. A reply that contains a dollar amount not in your facts is rejected and replaced with measured facts. |
- The panel shows the summary, four figures (Expected / day, Actual / day, Extra per day and Monthly run-rate), Likely causes and What to check.
- If the plan does not include AI you see a note: "AI-written explanations are available on the Scale plan; you are seeing measured facts", with a link to the plans. A daily limit and a deployment setting can produce similar notes.
- Pressing Regenerate has a short cool-down (about a minute) between tries.
- If the anomaly's figures changed after the explanation was written, the panel warns that it may be out of date.
- After each scan, up to five new high or critical anomalies per organisation are explained automatically, so a notification can carry a one-line summary.
Correlated services
When one service spikes, others often do too, for example a data-transfer charge rising with a compute charge. CostGlass records up to five other services on the same account and day whose cost also rose clearly (z-score of at least 2 and above your minimum increase). They are saved with the anomaly and shown as evidence in the Explanation, so you can see "this is probably one event", not several.
Notification rules by threshold
The Anomaly Notification Rules by Threshold card decides who is told, based on how big the anomaly is. It sits on the Anomalies page. Owners and admins can add, change, test, mute and delete rules. Others can view them.
Create a rule
Exactly how rules behave
- Two ladders. Amount rules form one ladder and percent rules another. They are independent, so one anomaly can notify one rule from each.
- Highest tier only. If several rules in a ladder match, only the one with the highest threshold notifies. If you want people on a lower rule to hear about big anomalies too, add them to the higher rule.
- Once per tier, with escalation. An anomaly is announced once. If it later grows past a higher threshold, it is announced again for that higher tier.
- Recent only. Only open anomalies detected in the last 3 days are considered, so creating a new rule never floods a channel with old news.
- Scope. A rule applies only if the anomaly's cloud and service are inside its scope. A blank scope means everything.
- Duplicates. You cannot save two identical all-clouds rules at the same threshold.
- Limit. Up to 20 rules per organisation.
Muting and quiet hours
Mute a rule for 1 hour, 8 hours, 24 hours or 7 days (or until a time you pick) from the rule card; Unmute ends it early. Quiet hours repeat every day in the timezone you choose.
Both hold notifications rather than discard them. Nothing is sent while the rule is muted or in quiet hours. Afterwards, anything still open and detected within the last 3 days is sent.
Daily digests
A rule set to digest never sends individual alerts. Instead, once a day (around 08:00 UTC) it sends one summary of matching open anomalies detected in the last 7 days, largest first, showing the top ten. If there is nothing to report, nothing is sent. Use Send digest now to send today's summary immediately.
PagerDuty
A PagerDuty channel opens an incident per anomaly. When that anomaly is later marked Resolved, CostGlass sends the matching resolve, once. Acknowledged or snoozed anomalies do not resolve the incident. Digest incidents are not resolved automatically.
Channels and secrets
Slack and Teams webhook addresses and PagerDuty keys are write-only. After saving, CostGlass shows only the last four characters and keeps the value in a secrets vault. Leave the secret box empty when editing to keep the saved one. Webhook hosts are checked: Slack must be hooks.slack.com, and Teams must be a Microsoft webhook or Workflows address. See All alert and notification types for details. An Email test goes only to you, whatever addresses are in the rule.
What to do when an anomaly appears
Limits
- Detection finds rises. It does not flag cost drops.
- A cloud with only monthly data is skipped.
- A new service needs about a week of history before it can be judged.
- Anomaly amounts here are in the product's fixed-rate unit shown in your display currency, but notification thresholds are in US dollars.
- Anomalies found for a vendor that has no connected account or connector to attach them to are listed as "Detected but not saved" in the scan result.