Connect a Kubernetes cluster
Install OpenCost and the CostGlass exporter in your cluster so cost data is pushed to CostGlass every 15 minutes.
Connect a Kubernetes cluster
Install the open-source OpenCost agent in your cluster and a small CostGlass exporter that sends cost data to CostGlass every 15 minutes.
- CostGlass never connects to your cluster. A small CronJob inside the cluster sends cost data out to CostGlass over HTTPS. Nothing is opened inbound.
- Two things are installed: OpenCost (with Prometheus, which it needs) and the CostGlass exporter (a Secret, a ServiceAccount with read-only access, and a CronJob).
- The install commands are generated for you, with a private ingest token for that one cluster. Copy them, run them, and the cluster appears by itself.
- The first data usually appears within about 15 to 30 minutes, once the CronJob has run and Prometheus has collected some history.
- Disconnecting a cluster revokes its token and deletes its stored live cost data.
How it works
Kubernetes does not send you a bill. Your cloud bills you for the machines (nodes) that the cluster runs on, and Kubernetes then shares those machines between many applications. To say what each team or application costs, you need to measure how much CPU, memory and storage each one uses and price it. CostGlass does this with OpenCost, an open-source cost tool from the CNCF (the foundation behind Kubernetes).
costglass-opencost-exporter runs every 15 minutes. It asks OpenCost for the numbers, and optionally asks the Kubernetes API for pod, node and storage health, then sends everything to CostGlass in one HTTPS request.get and list on pods, nodes and persistent volume claims, used for the Health tab and to discover your nodes. It is optional.This is separate from your cloud-account connections (AWS, Azure and so on). You do not need an AWS or Azure connection to use Kubernetes Costs, but if you have one, CostGlass can compare its Kubernetes figures with what the cloud actually billed (see reconciliation).
Supported clusters
OpenCost itself works on any Kubernetes cluster. CostGlass changes only two things per provider: one OpenCost setting and the provider label stored with the data.
| Choice in the form | Cluster type | What the install command does |
|---|---|---|
| AWS (EKS) | Amazon EKS | Adds --set opencost.exporter.cloudProvider=aws. |
| Azure (AKS) | Azure AKS | Adds cloudProvider=azure. |
| Google Cloud (GKE) | Google GKE | Adds cloudProvider=gcp. |
| Oracle Cloud (OKE) | Oracle OKE | No cloudProvider flag. OpenCost detects Oracle itself and prices nodes from Oracle's public price list. No Oracle credentials are involved. |
| DigitalOcean (DOKS) | DigitalOcean DOKS | Adds cloudProvider=custom. |
| Linode (LKE) | Linode LKE | Adds cloudProvider=custom. |
| Bare Metal / Other | Self-managed or any other cluster (the Cloud Accounts form option) | Not specially recognised by the server, so it is treated as AWS-style settings. See the note below. |
alibaba or civo is requested, but the connect forms do not offer them. For a cluster that is not listed, use the closest option and check the figures: node prices for providers without a price source in CostGlass are not added (see Kubernetes Costs). The "Bare Metal / Other" choice has not been specially tested by us.The in-app "Connect OpenCost Agent" window on the Kubernetes Costs page offers six buttons: EKS, AKS, GKE, OKE, LKE and DOKS.
- A Kubernetes cluster you can reach with
kubectl, and permission to create namespaces, ClusterRoles and CronJobs (cluster-admin is the simple way). helmversion 3 installed on the computer you will run the commands from.- Outbound HTTPS from the cluster to the CostGlass API (api.costglass.com for the UK region, your own region's API address otherwise). No inbound rules are needed.
- A cluster that can pull images: the exporter uses the public python:3.11-alpine image and installs one Python package (requests) when it starts, so it needs internet access to the image registry and to PyPI.
- A plan that includes Kubernetes Costs (Growth or above) to see the data page. The connection form itself is available on every plan, within your plan's connection limit.
Connect a cluster, step by step
There are three places that open the same form: Settings → Cloud Accounts (the Kubernetes tab), the onboarding page (Kubernetes, labelledOpenCost Agent), and the Connect OpenCost Agent button on the Kubernetes Costs page. The first two share exactly the same screen.
Settings → Cloud Accounts → Kubernetes: connected clusters at the top, and the form to connect a new one below.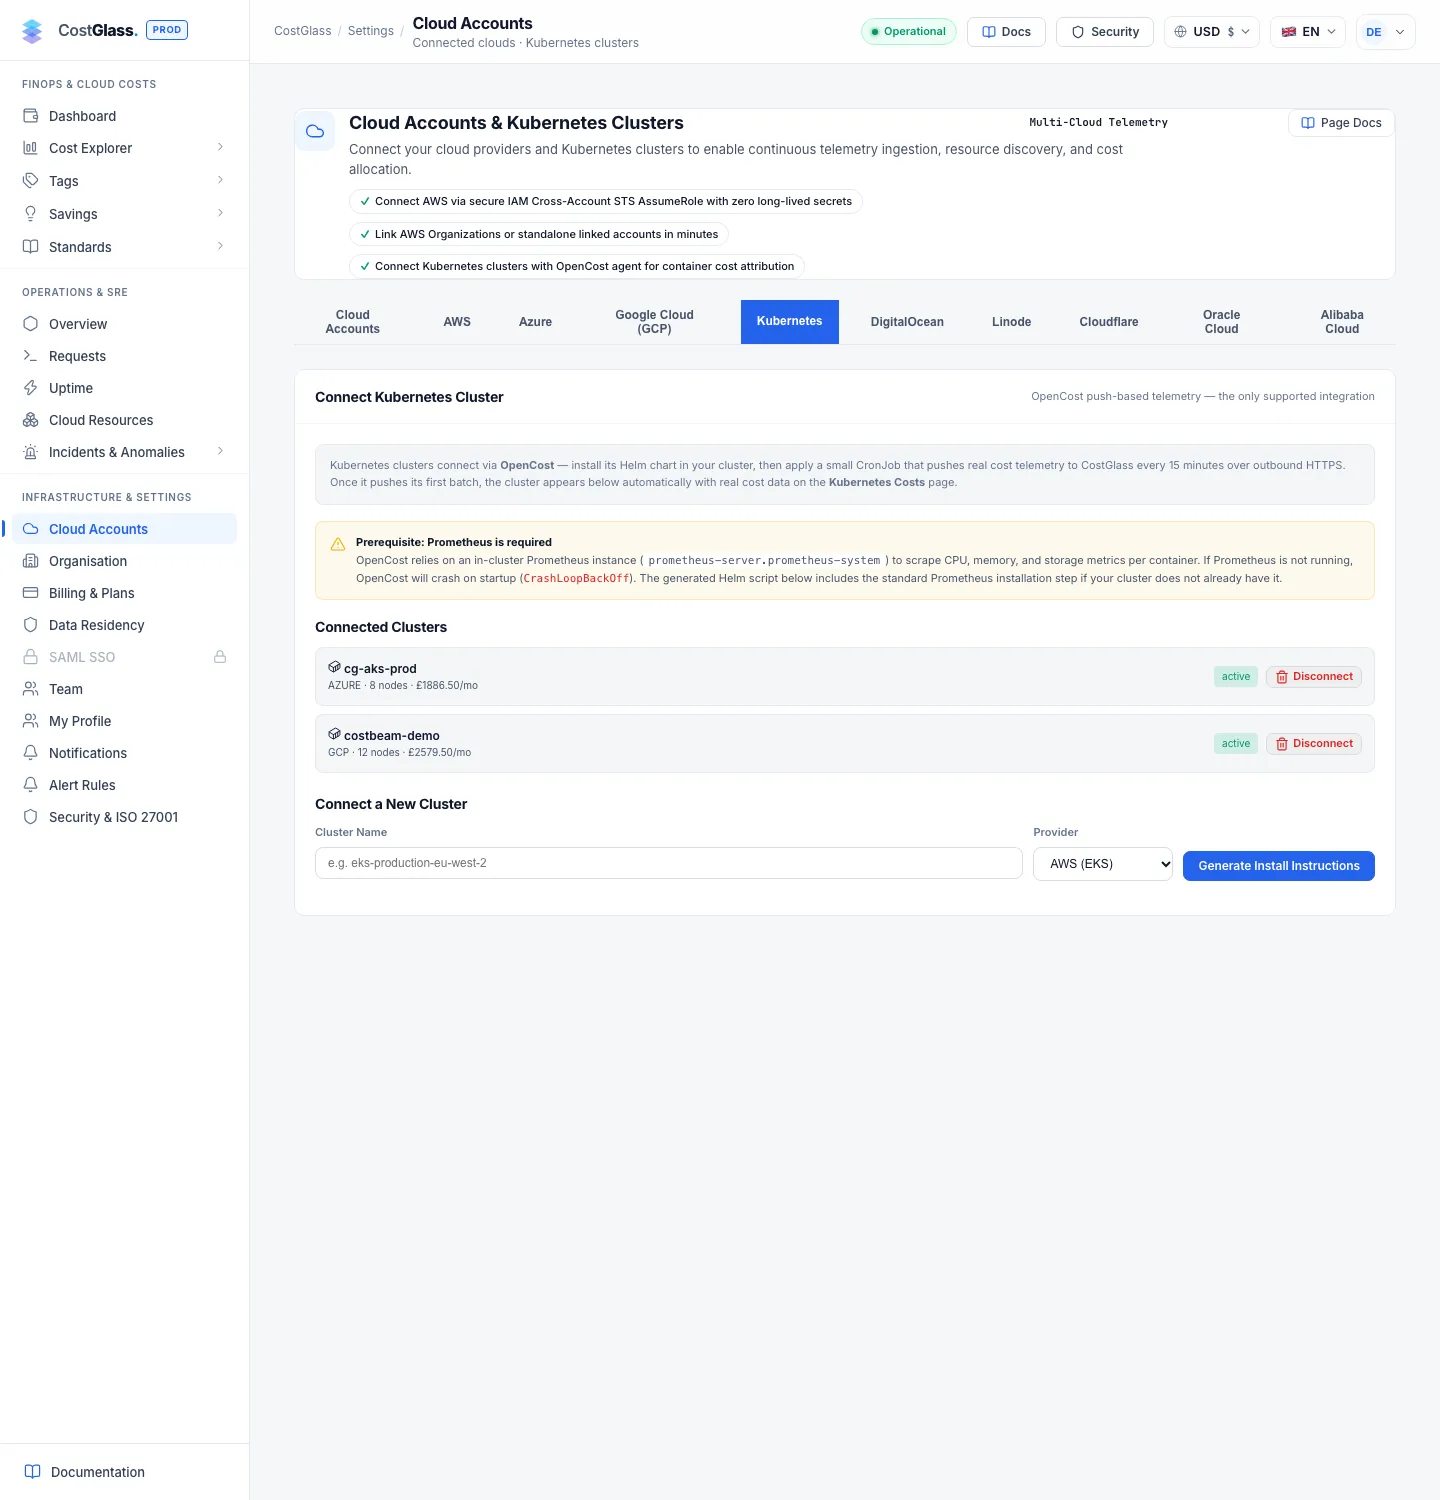
production-eks or gke-main. This name is how the cluster appears everywhere in CostGlass. Use a short, unique name; it is part of the token, so changing it later means a new connection.costglass-agent.yaml, and run kubectl apply -f costglass-agent.yaml.What is generated, exactly
1. The Helm commands
The commands install Prometheus (skip that step if you already run Prometheus at prometheus-server.prometheus-system) and then OpenCost into a namespace called opencost. For an EKS cluster they look like this (the cloud setting changes with your choice):
opencost.carbonCost.enabled=true switches on OpenCost's own carbon estimates, which feed the Carbon tab.
2. The agent manifest (costglass-agent.yaml)
One file with four things in the opencost namespace:
| Object | Name | Purpose |
|---|---|---|
| Secret | costglass-exporter-token | Holds INGEST_TOKEN, the private token for this cluster. |
| ServiceAccount | costglass-opencost-exporter | The identity the exporter runs as. |
| ClusterRole and ClusterRoleBinding | costglass-opencost-exporter-health-reader | Read-only: get and list on pods, nodes and persistentvolumeclaims. Optional. |
| CronJob | costglass-opencost-exporter | Runs every 15 minutes (*/15 * * * *), one run at a time, using the python:3.11-alpine image with a small memory and CPU limit (64 to 256 MiB, 50 to 200 millicores). |
The CronJob each time does the following:
- Asks OpenCost (inside the cluster) for allocations over the last hour in 15-minute steps, grouped by namespace, controller, pod and workload kind, plus the labels
app,envandteam. Idle cost is included and thekube-system,istio-systemandmonitoringnamespaces are treated as shared. - Asks OpenCost for its carbon estimate for the last hour. If this fails (older OpenCost, or the carbon flag was not set), it logs a warning and carries on.
- Asks the Kubernetes API, using its own ServiceAccount, for pod phases, restart counts, node readiness and storage claims. It also reads your node sizes, region and Kubernetes version from there. If the optional RBAC was not applied, it skips this.
- Sends it all to CostGlass with the token in the
X-CostGlass-K8s-Tokenheader.
You can view the Secret, RBAC and CronJob separately under Need individual manifests? View the Secret, RBAC and CronJob separately if your change process needs them as separate files.
Is the RBAC part optional?
Yes. Without it the cost data still arrives. What you lose: the Health tab stays empty, and CostGlass cannot read your real node count, CPU, memory, region and Kubernetes version from the cluster, so those details may be missing. If your security team rejects cluster-wide read access, remove the ClusterRole and ClusterRoleBinding from the file before applying. Because the all-in-one manifest includes them, apply the pieces separately in that case.
Check that it works
kubectl get pods -n opencost. The OpenCost pod should show 2/2 Running. If it is crash-looping, Prometheus is probably missing (see Troubleshooting).kubectl get cronjob -n opencost, then after the next quarter-hour kubectl get jobs -n opencost and kubectl logs job/<job-name> -n opencost. A good run ends with a line starting CostGlass Ingest Success.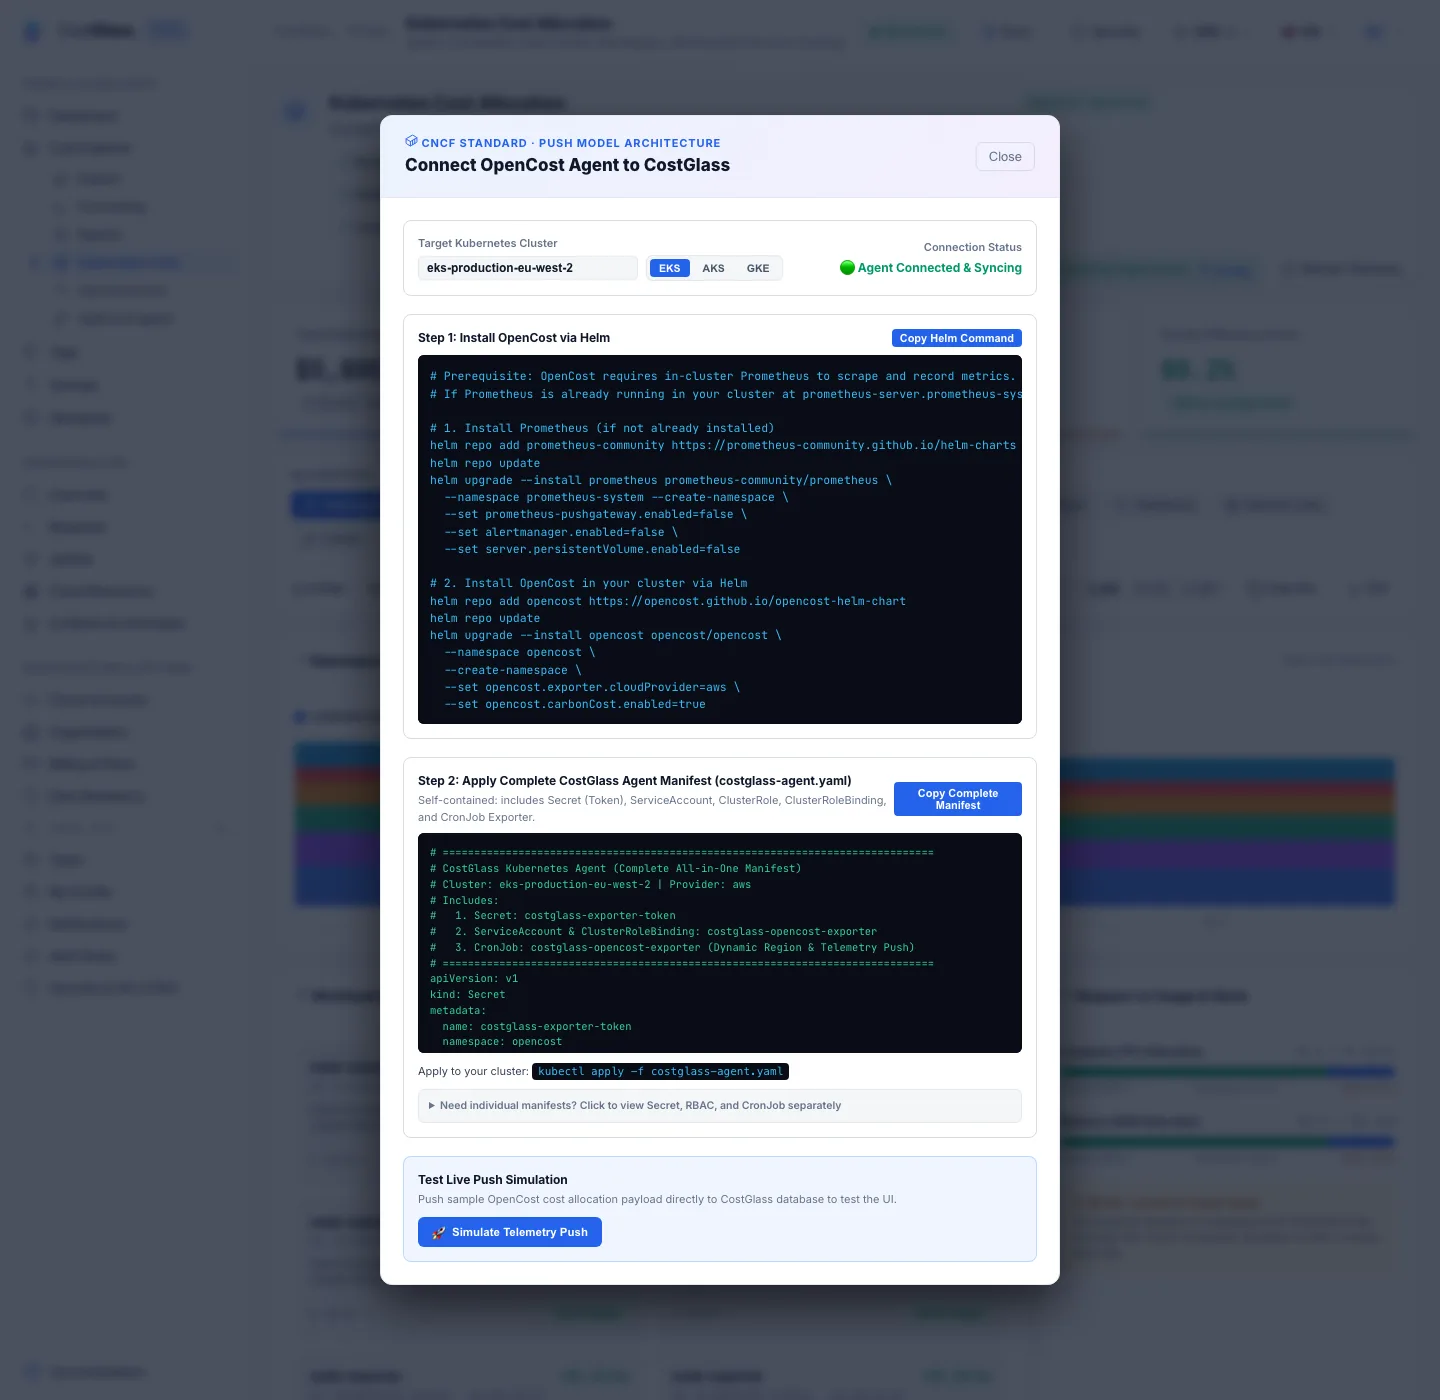
How long until data appears?
The exporter runs every 15 minutes, so the first push arrives within 15 minutes of applying the manifest. Cost figures are available from that first push. Some columns, such as actual CPU and memory usage on the Rightsizing tab, need Prometheus to have collected enough history first, which can take longer. Charts need more than one day of pushes to show a trend.
The Simulate Telemetry Push button
The Kubernetes Costs page's connect window has a button called Simulate Telemetry Push under "Test Live Push Simulation". It writes sample cost data for the cluster name into CostGlass so you can see how the page looks.
Remove a cluster
kubectl delete -f costglass-agent.yaml, and if you no longer need OpenCost, helm uninstall opencost -n opencost (and Prometheus if you installed it only for this).Disconnecting revokes the ingest token straight away (further pushes are refused), and deletes the cluster's stored allocations, its cluster record, its inventory entry and any matching connection record. The daily cost history already written to your cost history is not removed by this action. Note that the confirmation text says history is kept: in practice the live allocation tables are deleted.
Troubleshooting
| What you see | Likely cause | What to do |
|---|---|---|
| No data on the Kubernetes Costs page after 30 minutes | The CronJob has not run, or the push failed. | Run kubectl get jobs -n opencost and read the latest job's logs. Look for Failed to fetch OpenCost telemetry (OpenCost not reachable) or CostGlass Ingest HTTP error (token or network problem). |
| OpenCost pod in CrashLoopBackOff | Prometheus is missing or at a different address. | Install Prometheus with Step 1, or point OpenCost at your own Prometheus. Then check kubectl logs for the OpenCost pod. |
| Exporter log says INGEST_TOKEN is missing | The Secret is missing or in the wrong namespace. | Check kubectl get secret costglass-exporter-token -n opencost. |
| HTTP 401 or 403 when pushing | The token was revoked (you disconnected the cluster) or the cluster name changed. | Generate new instructions and re-apply the manifest. |
| Pods stuck in Pending in the opencost namespace | The cluster has no free capacity, or Prometheus is waiting for storage. | Run kubectl describe pod on the pending pod and read the Events. Add node capacity or adjust the Prometheus storage settings. |
| Health tab says it needs the RBAC | The ClusterRole and binding were not applied. | Apply the RBAC part of the manifest. Costs are unaffected either way. |
| Carbon tab says it needs carbon estimates enabled | OpenCost was installed without the carbon flag (or an older version). | Re-run the Helm command, which includes opencost.carbonCost.enabled=true, then re-apply the manifest. |
| New cluster is missing from the Cluster drop-down | Your browser may be showing an earlier list. | Reload the page. The cluster list is fetched fresh on each visit and is not cached by the one-hour browser cache, so it should appear once the first push has arrived. If not, check the exporter logs. |
| Region or node details are blank | The optional RBAC was not applied, so node details could not be read. | Apply the RBAC and wait for the next push. |