Cost Explorer
Slice, compare and drill into spend across every connected cloud: group by, filters, charts, overlays, details, AI, links and export.
Cost Explorer
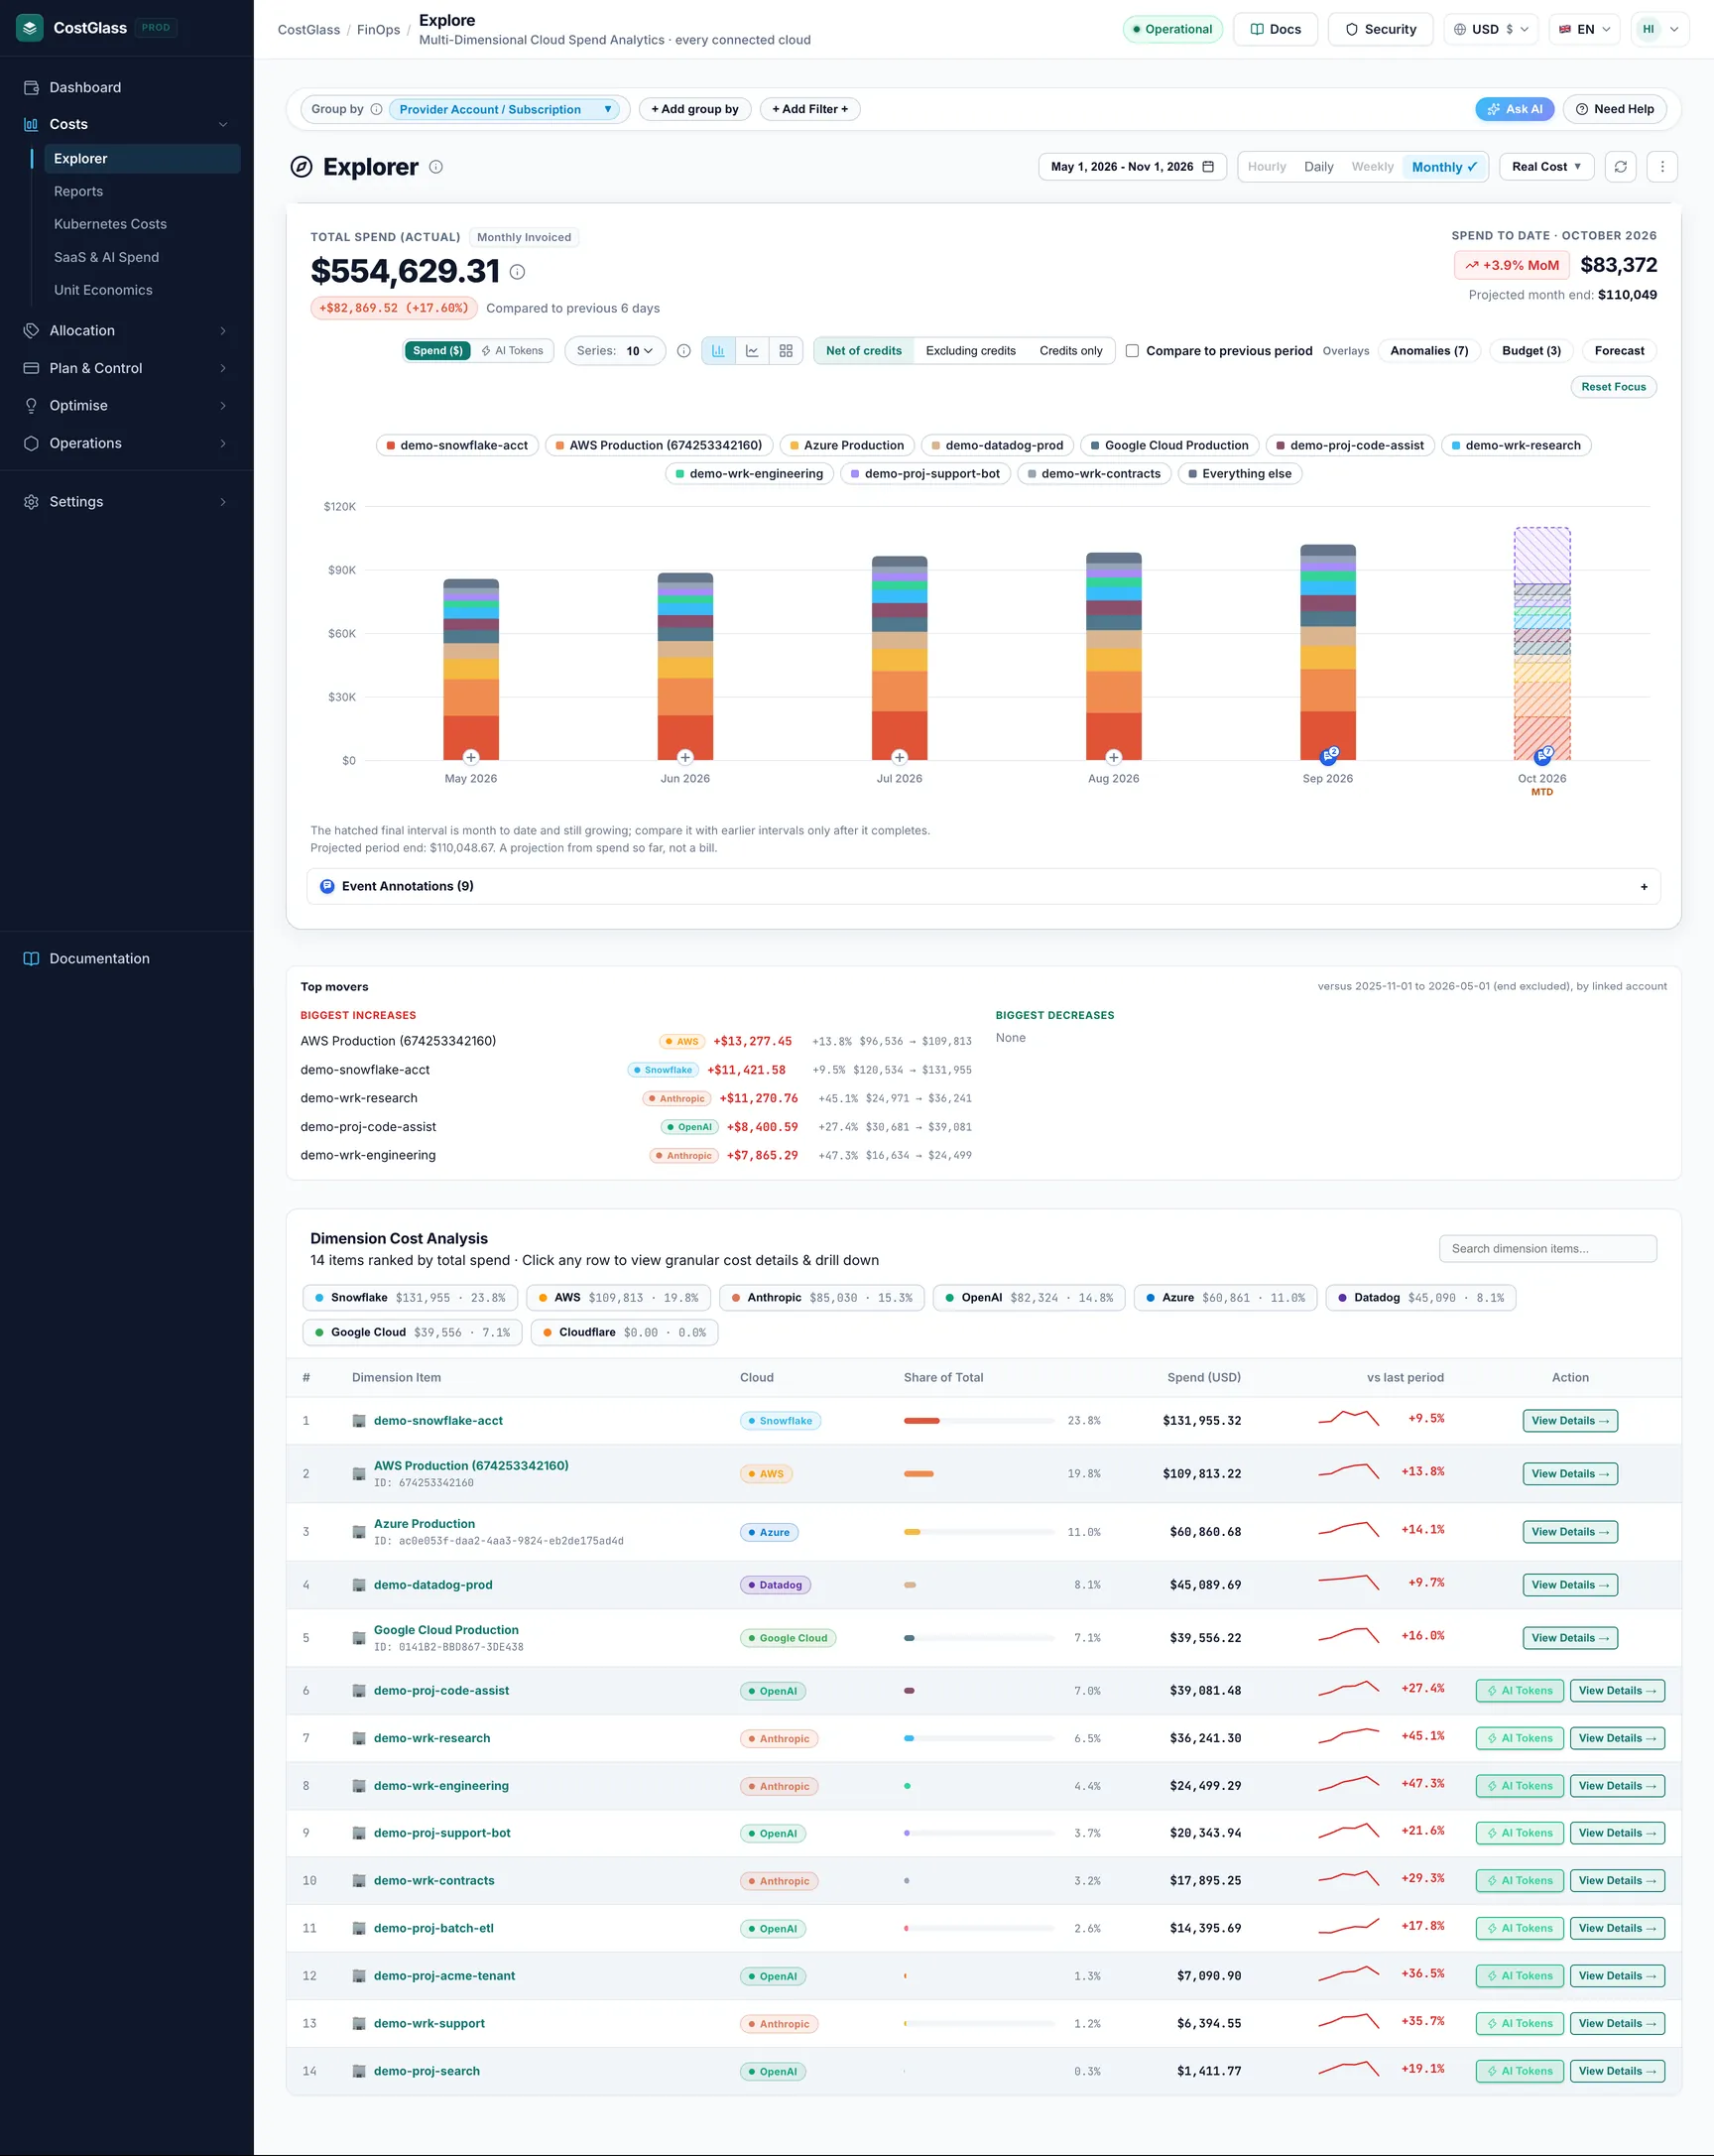
The page where you slice your spend by service, account, region, tag and more, across every connected cloud, compare it with the previous period and drill down to the line that caused a change.
- Cost Explorer answers "where is the money going, and what changed?" for AWS, Azure, Google Cloud, Oracle, Alibaba, DigitalOcean, Linode, Cloudflare, Kubernetes and AI/SaaS vendors on one screen.
- Pick what to group by (service, account, region, tag...), the time range and the filters. The chart, the ranked table and the "Top movers" strip all follow your choices.
- Every number is compared with the previous period of the same length, so increases and decreases are visible straight away.
- Click a bar, a treemap tile or a table row to open the detail drawer and keep drilling down. Use "Filter in Explorer" to keep what you found.
- The address bar always holds your exact view. Copy it, or save it as a view and have it emailed on a schedule.
- CostGlass only shows what your clouds reported. Where a cloud cannot answer a question, the page says so instead of guessing.
- At least one cloud (or AI/SaaS vendor) connected. See the Connect guides, starting with the connect overview.
- Some cost data. After you connect, the first data arrives from the scheduled sync (every 6 hours), or sooner with Sync with Cloud Now. AWS Cost and Usage Report (CUR) exports can take up to 24 hours to deliver the first file.
- If you were given access to only part of the organisation (an organisation node), Cost Explorer shows only the accounts in that part.
What Cost Explorer answers
Cost Explorer is a question tool. You do not need to know FinOps (the practice of managing cloud spend) to use it. These are the questions people use it for most:
- How much did we spend, and on what? Group by Service Name and read the ranked table.
- Why did the bill go up? Look at the percentage pill beside the total, then at Top movers, then click the biggest mover.
- Which team, account or environment costs most? Group by Provider Account / Subscription, by a tag, or by a virtual tag.
- What does one service cost in one region, across clouds? Use filters (see the recipes below).
- Are we on track for the month? Use the Projected Month-End pill, or turn on the Forecast and Budget overlays.
Cost Explorer reads the cost records CostGlass has stored for your organisation. It does not change anything in your clouds.
Layout tour, top to bottom
Every control, in a reference table
Group by
"Group by" decides what each bar segment, each table row and each treemap tile represents. It is the first thing to set. The dropdown is organised in groups:
| Option | What it shows | Good to know |
|---|---|---|
| Service Name | Spend per cloud service, for example a compute or storage product. Each row carries a cloud badge. | The default. Rows also show a "Save £X/mo" badge when the savings engine has an open recommendation for that service. |
| Provider Account / Subscription | Spend per AWS account, Azure subscription, Oracle tenancy, Google Cloud project and so on. | Account names are shown where CostGlass can resolve them, with the ID underneath. |
| Region | Spend per cloud region, as the cloud names it (for example eu-west-2 or uksouth). | Cost Explorer shows the raw region code. The Reports page maps the same place on different clouds to one name. |
| Usage Meter | The finest usage line the cloud reports for a service. | Depends on what each cloud reports. If it cannot be shown, a card says so and offers Switch to Services. |
| Charge Category | What kind of charge it is: usage, purchase, tax, credit, adjustment. | Useful to see taxes, commitment purchases and credits separately. |
| Instance Type | Spend by instance size or type (compute group). | Where the cloud reports it. |
| Operating System | Spend by operating system (compute group). | Where the cloud reports it. |
| Commitment / Purchase Model | On-demand versus reserved or savings-plan style purchase (compute group). | Where the cloud reports it. |
| Kubernetes Cluster and Kubernetes Namespace | Spend per Kubernetes cluster or namespace from the CostGlass OpenCost agent. | Kubernetes figures are run-rate projections from the agent. See the Kubernetes costs guide. |
| Kubernetes Pod | Spend per pod, the finest level CostGlass tracks. | There is nothing below a pod, so its detail drawer has no further split. |
| Virtual tag: ... | One entry per virtual tag you created (see Virtual tagging). Groups spend by the tag's values, for example team or product. | Appears only when you have virtual tags. Rules are applied to billed cost, so editing a rule re-groups all history. |
| Tag: ... | One entry per cloud cost-allocation tag key (the tags your engineers put on resources). | AWS only, and only with live AWS Cost Explorer access (see the honest data notes). For other clouds use virtual tags. |
+ Add group by does not add a second grouping. Each click moves to the next of four common groupings (Service Name, Provider Account / Subscription, Region, Usage Meter). To see two things at once, group by one and filter by the other, or use the Reports page, which has a two-way matrix.
Time range and granularity
Granularity is how wide each bar is: one day (Daily) or one calendar month (Monthly). Hourly and Weeklyare shown but switched off. The date range button lists the ranges:
| Range | Default view | Notes |
|---|---|---|
| Last 7 Days (7D) | Daily | The seven days before today plus today. |
| Last 30 Days (30D) | Daily | The thirty days before today plus today. |
| Current Month (MTD) | Daily | Month to date. Shows "Total Spend to Date" and the Projected Month-End pill. |
| Last Month | Daily | The previous calendar month, day by day. |
| Last 3 Months (3M) | Monthly (the page default) | Can also be shown Daily (the last 90 days). |
| Last 6 Months (6M) | Monthly | Monthly only. |
| Last 12 Months (12M) | Monthly | Monthly only. CostGlass keeps up to 13 months of history. |
| Year to Date (YTD) | Monthly | From 1 January. |
| Custom Date Range... | Daily up to about 62 days, otherwise Monthly | Pick From and To dates (not in the future), then Apply Range. Daily is allowed up to 92 days; the picker shows "Daily supported" when it is. A Monthly custom range rounds out to whole calendar months. |
If you click Daily while on a long range (6M, 12M, YTD) the page switches to Last 30 Days. If you click Monthly while on 7D or 30D it switches to Last 3 Months. The big headline says Daily Telemetry or Monthly Invoiced beside it so you always know which you are looking at.
Cost basis: Real Cost or Amortized Cost
- Real Cost (Unblended)
- The money as billed, on the day it was billed. If you buy a one-year commitment and pay up front, the whole payment appears on the purchase day, so that day looks huge. This is the default and matches the invoice most closely.
- Amortized Cost
- The same payment spread evenly across the commitment term, so every day carries its fair share. Use it to judge the true running cost of your workloads when you buy Reserved Instances or Savings Plans.
Credits: Net, Excluding, Only
Cloud providers give credits, promotions and refunds. The credits switch in the chart header decides how they are treated:
| Option | Meaning |
|---|---|
| Net of credits | What the cloud invoices: usage minus credits. The default. |
| Excluding credits | Gross usage cost with credits left out. Use it to see the real consumption behind a bill that credits are hiding. |
| Credits only | Only the credit lines, shown as a negative total. |
A line under the chart shows "Usage · Credits · Net" when credits exist or when you are not on the default. Some clouds do not report credits through their API; the line says which. Your choice is remembered for you, and a shared link carries it.
Filters: single, multi-select, include and exclude
There are two kinds of filter, and they combine (a row must match all of them):
- Quick filters. Clicking Details then Filter in Explorer, clicking a cloud chip in the table, or the AI assistant sets a single value for Cloud, Account, Service or Region. These appear as chips beside + Add Filter.
- Multi-select filters in the tray: Cloud, Service, Region, Account and Virtual tag. Open one, choose is (include) or is not (exclude), search, tick values, press Done. You can include and exclude in the same filter. Up to 50 values each.
| Control | What it does | Notes |
|---|---|---|
| is | Keep only the ticked values. | Several included values are OR-ed together within one filter (Service is A or B). |
| is not | Remove the ticked values and keep everything else. | Shown as a red chip marked "not" with the name struck through. This is how you answer "everything except production". |
| Saved filters | Apply, create, rename, share and delete reusable filters. | See the Saved views, filters and emails guide. Up to 5 can be applied at once. |
| Show resources / Hide resources | Toggles the Top resources panel under the tray. | See "Resources panel". |
| Clear all | Removes the four quick filters and returns to Group by Service Name. | It does not clear multi-select filters; remove those in the tray. |
Search, currency and refresh
| Control | What it does |
|---|---|
| Search dimension items... | Narrows the Dimension Cost Analysis table by name as you type. It changes only the table: the chart, total and export are not affected. |
| Currency | Amounts are shown in the currency you chose for the app (the currency selector). Costs are stored in US dollars and converted at the latest rate when displayed. When your display currency is not USD, the table adds a Base (USD) column with the exact dollar amount. |
| Refresh icon | Re-reads your stored data and bypasses the one-hour browser cache for this view. |
| Sync with Cloud Now | Asks the connected clouds for fresh data right now, then reloads the page. See "Data freshness". |
| Series (5, 10, 15 or 20) | How many named items the chart draws before folding the rest into "Everything else". |
| Spend ($) / AI Tokens | Switches the chart area between cost and the AI token view (usage, cache hit rates, prompt metrics) for AI vendors. |
Reading the headline numbers
- Total Spend (Actual) (or Total Spend to Date (Actual) on Current Month) is the sum of everything that matches your filters in the selected period. "Actual" means recorded charges, not a forecast.
- The pill beside it shows the difference from the previous period, in money and in percent. Red means spend went up, green means it went down. The wording next to it says "Compared to previous N days"; the comparison is against the immediately preceding period of the same length (for months, the same number of previous months; for month to date, the same number of days of the previous month).
- Projected Month-End appears on Current Month. It is a projection from your run rate, not a bill (see the Forecast overlay).
- On Current Month in a daily view, a small line may add "X in daily telemetry". That means some monthly-invoiced vendors (for example Datadog) are in the total but have no daily data; the tooltip gives the difference.
The chart: stacked bars, lines and treemap
Choose the chart type with the three icons beside Series.
| Type | What you see | Best for |
|---|---|---|
| Stacked bars | One bar per day or month. Each coloured segment is one item (service, account...). The same colour is used in the legend, the tooltip and the table. Hover for the exact split. | How total spend is built up and when it changed. The only type that supports the overlays. |
| Lines | One line per item plus a total line, so you can compare trends without the stacking. | Seeing whether one item is rising while others fall. |
| Share (treemap) | One rectangle per item; the area is its share of the whole. Click a tile to open its details. | Seeing proportions at a glance. It shows the whole selected period, not a time axis. |
How to read it
- Everything else. Only the top N items (the Series setting) are drawn. The rest are folded into a striped grey "Everything else" segment so it cannot be mistaken for a real item. The table below still lists every item.
- Hatched last bar, "MTD". The final interval is month to date and still growing. Do not compare it with complete months until it finishes.
- Show or hide series. Click an item in the legend to hide or show it.
- Click a bar to focus that day or month. A Detailed Spend Focus table appears under the chart with the ranked items for just that period, their share and amount. Click any of its rows to open the drawer. Reset Focus or Close Focus returns to the whole range.
- Compare to previous period (not on the treemap) overlays a dashed line for the previous period, matched day by day or month by month. A caption names the dates compared. If there is no previous-period data the switch is disabled.
Overlays: anomalies, budgets and month-end projection
Overlays are chips named Overlays above the chart. They are available on stacked bars only, and each shows a count.
| Overlay | What it draws | When it is unavailable |
|---|---|---|
| Anomalies (n) | Marks the days on which CostGlass detected an unusual cost increase for services in your current view, with severity and status. | Greyed out when there are none in the period. Up to 200 are loaded. |
| Budget (n) | A line for each budget that applies to this view. Monthly budgets are divided by the days in the month on a daily chart; quarterly and annual budgets are shown as a monthly equivalent. The 3 largest are drawn. | Greyed out when no budget applies. |
| Forecast | A projected month-end spend. Method: spend so far this month plus the average of the last 7 recorded days times the days left. Always labelled a projection, with the method shown. | Needs at least 7 days of daily spend in the current month; the selected period must include the current month; not available if your access is limited to part of the organisation. The chip shows the reason on hover. |
The ranked table: Dimension Cost Analysis
The card header says how many items there are. Above the table, cloud chips show spend and share per cloud; click a chip to show only that cloud, click again to show all.
| Column | Meaning |
|---|---|
| # | Rank by spend. |
| Dimension Item | The name (click it for details). A line below shows the ID when it differs from the name. In Service Name grouping a green "Save £X/mo" badge may appear: see "Savings hints". |
| Cloud | Which cloud bills the item. Shown only when rows carry a cloud. |
| Share of Total | Bar and percent of the filtered total. |
| Spend (currency) | Amount in your display currency. |
| Base (USD) | Exact US dollar amount. Shown only if your currency is not USD. |
| vs last period | A small trend line for this period and the change in percent against the previous period. Red up, green down. "new" means it had no spend in the previous period. "-" means no comparison is possible. |
| Action | Details → opens the drawer. Rows that look like AI vendors or models also get an AI Tokens button that switches to the token view. |
Top movers
The strip lists up to five Biggest increases and five Biggest decreases by absolute dollar change, against the previous period (dates shown). Each line shows name, cloud, change in money, change in percent and "previous → current". Changes under one cent are ignored. An item that existed before and has no spend now is shown as a decrease of 100 percent (it has "vanished"); an item with no previous spend is "new". If nothing was recorded in the previous period, the strip says there is nothing to compare against.
The detail drawer
Click an item to open the drawer. It always covers the whole selected period (even when you reached it from one bar) so its headline matches the chart.
- Summary cards: Period Spend, Base Spend (USD) when relevant, and Share of Total Bill.
- Granular Sub-Dimension Breakdown: pick another grouping to split this one item. The default depends on where you came from: an account splits by service, a service by usage meter, a region by service, a Kubernetes cluster by namespace. If the cloud cannot answer that split, a message explains why.
- Trajectory: mini bars for the item over time (monthly, or daily for Kubernetes).
- Filter in Explorer (or Apply Filter to Explorer →) closes the drawer and keeps what you found. An account becomes an account filter and the view regroups by service; a service becomes a service filter and regroups by region; a region becomes a region filter and regroups by service; a virtual tag value is added to the virtual tag filter and regroups by service.
- Why? (Cost Detective) (Service Name grouping only) opens a root-cause panel for supported services, showing who and what made the requests behind the cost.
Resources panel and savings hints
Top resources
Press Show resources in the tray. The Top resources card lists the individual resources behind the current view with Resource, Cloud, Service, Account, Region, State and Cost. You can search by ID or name and page through results. A line says "Resources carry X% of this view's spend": some charges (support, taxes, some usage) are not tied to a resource, so the list can cover less than 100 percent.
If a cloud does not record cost per resource, the panel says so for that cloud ("not recorded per resource") and suggests grouping by service, account or region instead. That is a limit of the data, not an error.
Savings hints on service rows
In Service Name grouping, a badge such as Save £120/mo measured means the Savings engine has open recommendations for that service. Hover for the list. The word at the end tells you how the figure was reached: measured (a real billed amount), list price (a real resource at the provider's published price) or estimate (a stated percentage). With several recommendations the badge shows the least certain basis so it never overstates. Figures are not added across overlapping recommendations. Click the badge to open Savings. Cost Explorer only reads stored recommendations; it never runs a scan.
Event annotations
Annotations are dated notes that explain a change in spend, for example "Migrated the data warehouse". They appear as markers on the chart and are listed in Event Annotations (n) under it. Everyone in your organisation sees them.
CostGlass also adds annotations itself for high-severity anomalies, budget alerts and cost alerts, labelled Anomaly, Budget or Cost alert, with a View issue link. See Issues and annotations.
Ask AI on this page
Ask AI opens CostGlass AI beside the page. It can read the view you are looking at (grouping, range, totals, ranked items) and answer in plain English. For questions that suit a view it can also change the page for you: set the grouping, range, cost basis, filters (including several services, regions, accounts or clouds at once) and turn on the previous-period comparison. You will see a "View updated" message listing what changed.
- It can only apply values that really exist in your data. Unknown names are dropped, and amounts quoted in answers come from your own figures.
- You must be signed in. There is a daily allowance per organisation; when it is used up you will see a message and can try again the next day.
- Treat its answers as a starting point. Open the drawer or table to confirm any figure before acting on it.
Links, saved views and exporting
Copy Permalink
Your whole view lives in the address bar and updates as you change things, so you can also just copy the browser's URL. Copy Permalink in the ⋮ menu does the same on purpose. Anything left at its default is left out, so links stay short.
| Part of the link | Holds |
|---|---|
| dim, tr, from, to, gran | Grouping, range, custom dates, daily or monthly. |
| basis, cr | Cost basis and credits mode. |
| prov, acct, svc, reg | The single-value quick filters. |
| svcs, xsvcs, regs, xregs, accts, xaccts, provs, xprovs, vtf, xvtf | Include (and x-prefixed exclude) multi-select filters, including virtual tag values. |
| sf | Applied saved filters. |
| q, pt, chart, lens | Table search, focused bar, chart type, Spend or AI tokens view. |
Saved views and scheduled emails
Open the filter tray and expand Saved views & scheduled reports to save the view, share it with colleagues, or email it daily, weekly or monthly. The full guide is Saved views, saved filters and scheduled emails.
Export CSV
Export CSV in the ⋮ menu downloads the ranked table as a file named like CostGlass_CostExplorer_SERVICE_last_3_months.csv, with the columns Dimension, Cloud, Spend (GBP), Spend (USD) and Share (%).
The export contains every ranked item for the view (it ignores the table search box). For formatted Excel or PDF packs, charts, month-on-month variance and scheduled delivery, use Custom Reports & Excel in the same menu, which opens Reports.
Data freshness and syncing
- Data is brought in by a scheduled sync about every six hours. AWS CUR exports arrive when AWS delivers them, which can take up to 24 hours.
- The Refresh icon re-reads what CostGlass already stored. It does not call your clouds.
- Sync with Cloud Now asks your connected AWS, Azure and Google Cloud connections for fresh data. If your AWS connection is a live (non-CUR) connection, AWS bills a small fee for the Cost Explorer API requests it makes (up to a handful of requests; AWS charges per request). CUR-only connections read from S3 instead. The page shows a toast saying how many records were synced, or what went wrong.
- For speed, the page keeps answers in your browser for up to an hour. A Refresh, a Sync or any change you make clears them.
Honest data notes: what the messages mean
| What you see | Why | What to do |
|---|---|---|
| "Granular grouping isn't available right now" | You combined an account with a service or region on a cloud that reports them separately (AWS live connection, Azure). There is no row that names both. | Group by one and filter by the other on a cloud that supports it, or use a CUR-based AWS connection. |
| "Usage Meter Breakdown" card | The selected cloud or view cannot be split into usage meters. | Press Switch to Services, or Clear Filter. |
| "Tag-based grouping isn't available right now" | Tag grouping uses live AWS Cost Explorer. A CUR-only connection or one without a usable role cannot do it, and it only supports Last Month, 3M, 6M and 12M. | Use a virtual tag instead, or connect AWS with live access. |
| "This virtual tag can't be shown" | The tag has no usable rules for the selected data, or depends on something unavailable. | Open Virtual tagging and check its rules. |
| "X has monthly cost data but no daily data for this period" | That cloud only reports monthly. | Choose Last 3 Months or longer in a monthly view. |
| "Showing only the accounts you have access to" | Your access is limited to part of the organisation. | Ask an admin if you need wider access. Projections are also switched off for scoped access. |
| "Not enough history" | Too little stored data to compare or project. | Wait for more data, or widen the range. |
| Empty Usage Type / Usage Meter | Not every cloud records usage lines. | Group by Service Name instead. |
| "(All Services)" rows | AWS (live) and Azure report per-account totals as a separate roll-up row with no service. They count in the Account view only and are left out of service and region views and of any account-with-service answer. | Nothing. This is how the data is kept so totals do not double count. |
Step-by-step recipes
Find what drove last month's increase
Cost of one service in one region across clouds
Compare two accounts
Everything except production
Share a view with finance
Why totals may differ from your cloud bill
- Currency. CostGlass stores US dollars and converts to your display currency at the latest rate. Your cloud invoice converts at its own rate on its own date. Compare in the invoice's currency using the Base (USD) column.
- Credits. The default is net of credits. If your invoice shows gross usage, switch to Excluding credits.
- Cost basis. Real Cost puts commitment payments on the day they were charged; Amortized Cost spreads them. Pick the same basis your finance team uses.
- Partial month. The current month is incomplete. The hatched MTD bar and a Projected Month-End are not the final invoice.
- Timing. The cloud may adjust charges for days after the fact, and CUR files arrive with a delay. Recent days can change.
- Charge types. Tax, support, refunds and purchases are included if the cloud reports them. Group by Charge Category to see them on their own.
- What is connected. Cost Explorer shows only accounts you connected, and only those you may see. An account missing from your connection is missing from the total.
- Several views. Reports, the Dashboard and Cost Explorer read the same stored records but can use different defaults (range, basis, credits). Align those first.