Dashboards
The Overview dashboard widget by widget, plus building custom dashboards you can share with your organisation.
Dashboards
The Overview dashboard shows your month at a glance. You can rearrange it, and build extra dashboards to share with your organisation.
- The Overview is built in. Its widgets can be dragged and resized, and your arrangement is saved to your user, not the organisation.
- Spend widgets are month-to-date. Nothing is invented: a widget with no data shows a dash or an explanation.
- Custom dashboards are made of widgets you pick: built-in cards, saved Cost Explorer views, saved reports, text notes and cost summaries.
- A custom dashboard is private to you or shared read-only with your whole organisation.
- Limits: 50 widgets per dashboard and 50 dashboards per user.
The Overview dashboard
Open Dashboard. The selector at the top left shows Overview (built-in) with a System Default badge. If a new organisation has a cloud connected but no spend yet, a No cost data yet card with Fetch data now appears; see the Quickstart.
The Overview dashboard with its default widgets.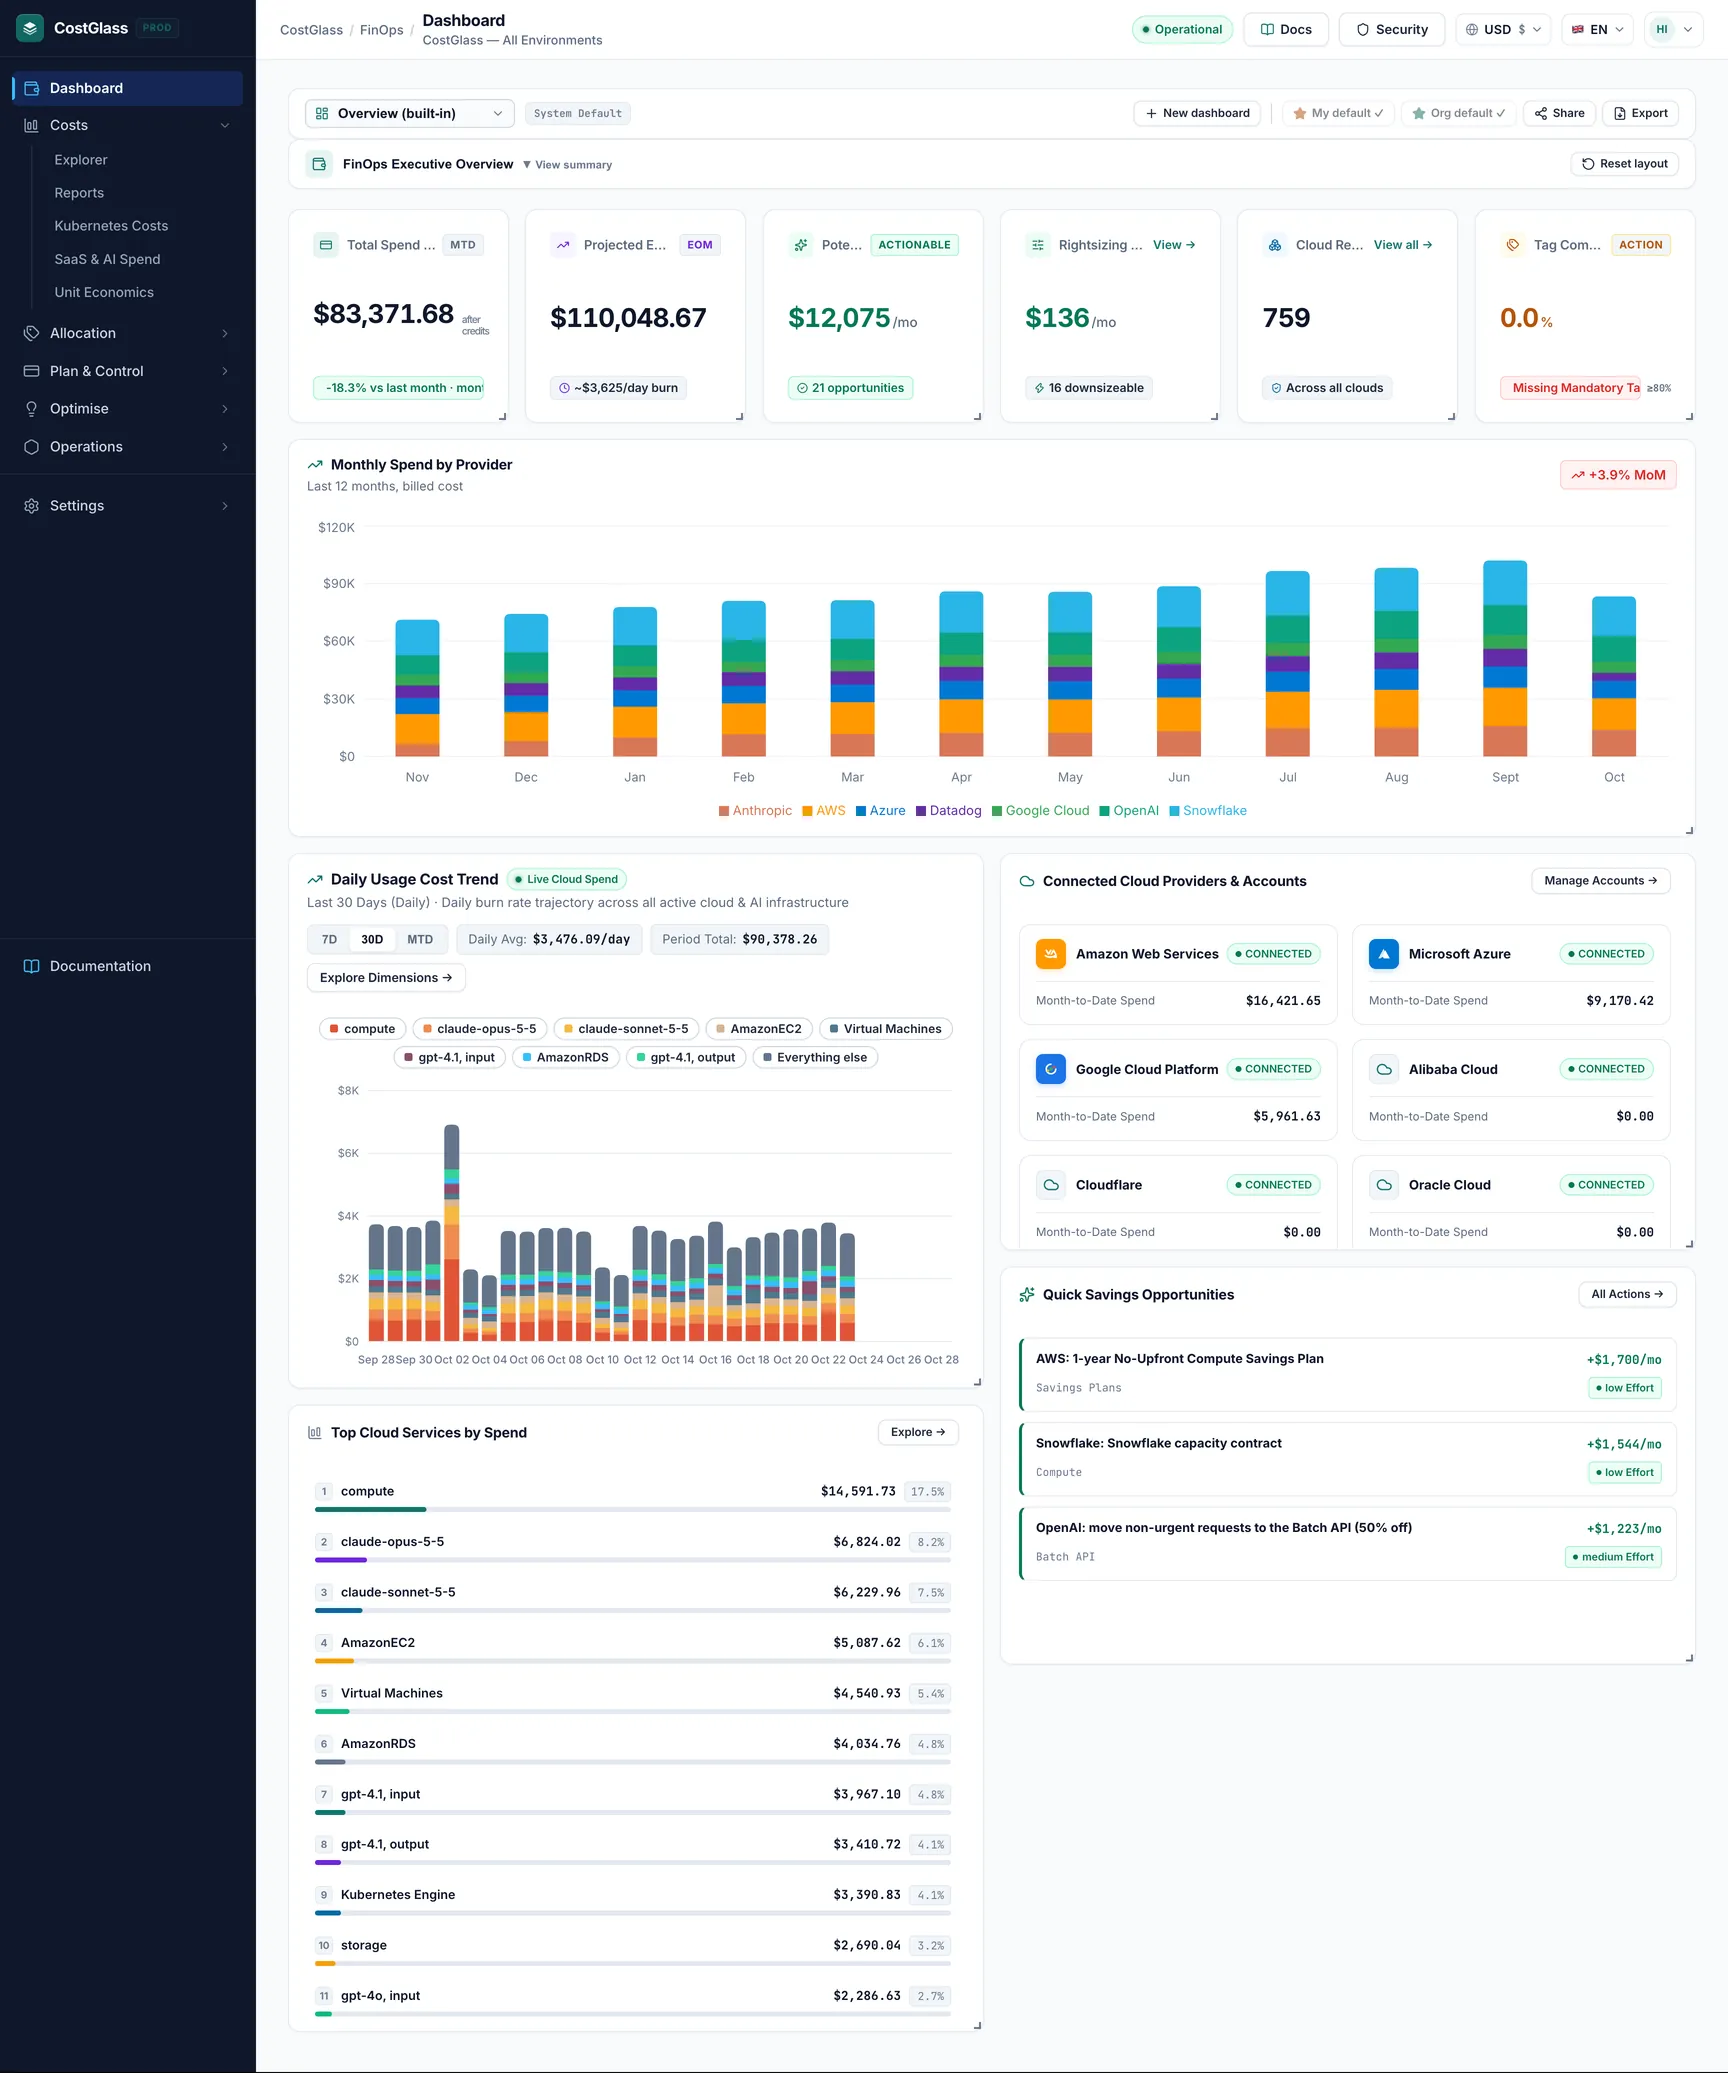
| Widget | What the number means | Where it comes from |
|---|---|---|
| Total Spend to Date | Spend so far this month across every connected cloud and AI/SaaS vendor, with the change against last month. Marked after credits when credits apply. | Your stored cost data for all providers. Month-to-date, so it is partial until the month ends. |
| Projected Month-End | Where the month is heading, with an average daily burn underneath. | Computed from your spend so far. It is a projection, not a promise. |
| Potential Savings | Monthly saving identified by the savings engine, with the number of opportunities. | The Savings page. Overlapping recommendations are counted once, so the total never exceeds your bill. |
| Rightsizing | Estimated monthly saving from resizing machines, with how many could be downsized. Shows a dash and a reason if there is no usage data. | Measured utilisation (CPU and similar) for EC2, RDS and Azure VMs. Links to Rightsizing. |
| Cloud Resources | How many resources were found across all clouds. Links to Cloud Resources. | The inventory, excluding terminated resources. |
| Tag Compliance | The percentage of resources with the required tags. Green and Passing at 80% or above, amber and Action below. | The Tag Compliance policy. |
| Daily Usage Cost Trend | A bar per day. Choose 7D, 30D or MTD. Click a bar to focus that day and see its top services. | Daily cost rows. Clouds that only report monthly totals do not appear here. |
| Connected Cloud Providers & Accounts | One tile per provider: Connected with its month-to-date spend, or Ready to connect. | Your connections and stored spend. |
| Top Cloud Services by Spend | The services costing most this period. The Cost Explorer button opens the full breakdown. | Stored cost data. |
| Quick Savings Opportunities | The highest-value savings with effort level. All Actions opens Savings. | The Savings page. If none, the card explains what the checks need. |
The FinOps Executive Overview strip
Above the widgets is a slim bar titled FinOps Executive Overview with View summary / Hide summary. It is collapsed by default and opens a short written summary of month-to-date spend, savings and tag compliance. Your open or closed choice is saved with your layout. The Reset layout button sits beside it.
Arranging the Overview
- The layout is stored per user. Teammates keep their own.
- The default arrangement: six number cards across the top, the daily trend at full width, connected providers under it, then Top Cloud Services and Quick Savings side by side.
- If new widgets are added to CostGlass later, they appear at the bottom of an existing layout without breaking it.
Custom dashboards
Use a custom dashboard when you want a page for one audience, such as an engineering lead or the finance team. Open the selector at the top left to switch between Overview (built-in), My dashboards and Shared with your organisation.
Create one
Widget types
| Tab | What it shows |
|---|---|
| Built-in | Any of the ten Overview widgets: Total spend to date, Projected end-of-month spend, Potential savings, Est. rightsizing savings, Cloud resources, Tag compliance, Daily usage cost trend, Connected cloud providers, Top cloud services by spend, Quick savings opportunities. |
| Saved view | A Cost Explorer view you saved (total and top rows), with an Open in Cost Explorer link. Save views from Cost Explorer. |
| Saved report | Shows the saved report's name with an Open Reports link. It does not render the report itself. |
| Text | A plain-text note (optional title, up to 2,000 characters). No formatting or links are interpreted. |
| Cost summary | Total spend and the split by provider for This month, Last month or Last 3 months. |
Share, default, duplicate, export
| Control | What it does |
|---|---|
| Private / Whole organisation | Who can see the dashboard. Shared dashboards are read-only for everyone except the creator and owners/admins. Switching back to private hides it from others again. |
| Set default / My default ✓ | Makes the selected dashboard the one you land on. A link with a specific dashboard in the address always wins. |
| Set org default / Org default ✓ | Owners and admins only. The dashboard everyone lands on unless they set their own. It must be shared with the whole organisation first (or be the Overview). |
| Share | Copies a link. It opens for people in your organisation who can see that dashboard. |
| Duplicate | Makes a private copy you own. |
| Rename | Changes the name. |
| Delete | Permanently removes it, for everyone if it was shared. You are asked to confirm. |
| Export | Opens your browser's print dialog so you can save the page as PDF. |
Limits and honest caveats
- Up to 50 widgets per dashboard and 50 dashboards per user.
- A private dashboard is invisible to everyone else. If a shared dashboard uses a saved view or report that is private to someone else, that widget shows This item is private to someone else, or was deleted rather than its contents.
- Saved report widgets show a link, not the report. Scheduled emailing of a dashboard is not available; schedule saved views and reports instead.
- The Overview is edited per user; only custom dashboards can be shared.
- Dashboard answers are cached in your browser for up to an hour; use the page's refresh or make a change to see fresh data (see Finding your way around).