Kubernetes Costs page
Understand cluster, namespace, workload and pod costs, idle capacity, rightsizing, carbon and health.
Kubernetes Costs page
See what each cluster, namespace, workload and pod costs, how much of it is idle, and where requests are bigger than real usage.
- Kubernetes costs are an allocation of your cloud bill: they show who inside the cluster uses what, and are not added to your total cloud spend.
- The figures are a monthly run-rate projected from the latest push (about 15 minutes of measurement), not a month of measured spend. They move as your workloads change.
- Idle cost is the price of node capacity that no pod has requested. Efficiency compares what pods use with what they asked for.
- Eleven tabs under "Allocate By" change how the same data is grouped: Namespace, Workload, Pod / Container, Cluster, Team / Label, Cluster Assets, Cost By Type, Rightsizing, Network Costs, Carbon and Health.
- Use it to find over-sized requests, empty node capacity and the namespaces that should be charged back to teams.
- At least one cluster connected and pushing data: Connect a Kubernetes cluster.
- A plan that includes Kubernetes Costs (Growth or above).
- For the Health tab, the optional read-only RBAC from the install manifest. For the Carbon tab, OpenCost installed with the carbon option.
What OpenCost measures
OpenCost watches the cluster and prices what each workload uses. The page can show these cost types; each is a field OpenCost itself reports and none of them is estimated by CostGlass:
| Cost type | What it is |
|---|---|
| CPU | The cost of CPU the workload reserved (requested) or used, whichever is greater, at your cloud's price. |
| RAM | The same for memory. |
| Storage | Persistent volumes (disks) the workload claims. |
| Network | Data transfer. Cross-zone, cross-region and internet egress are split out on the Network Costs tab. |
| Load Balancer | Load balancers created by Kubernetes services. |
| GPU | GPU time. The GPU swatch is hidden unless your data has GPU cost. |
| Shared | Cost of shared services that OpenCost spreads across workloads. The exporter treats the kube-system, istio-system and monitoring namespaces as shared. |
| External | Costs outside the cluster that OpenCost attributes to workloads (this is empty unless your OpenCost setup reports it). |
| Idle | Node capacity that no workload has claimed. |
OpenCost also reports, for each workload, how much CPU and memory it requested and how much it actually used on average. That pair is what makes rightsizing possible.
- Namespace
- A named group inside a cluster, often one per team, product or environment.
- Workload
- A running application managed by Kubernetes: a Deployment, StatefulSet, DaemonSet or Job.
- Pod
- The smallest running unit: one or more containers that run together on a node. A workload runs one or more pods.
- Node
- A machine (virtual or physical) the pods run on. This is what your cloud bills you for.
- Request
- The amount of CPU or memory a pod asks Kubernetes to reserve for it. Reserved capacity is paid for whether or not it is used.
- Idle / slack
- Capacity on the nodes that no pod has requested.
Why numbers are a monthly run-rate, and what that means
OpenCost reports each cost for the minutes it measured, normally one 15-minute step. The exporter sends a fresh measurement every 15 minutes and each push replaces the previous one. If CostGlass showed that raw figure it would be around 2,900 times too small, so CostGlass projects it: it merges the workload across the measured windows and scales the cost to a month (730 hours).
| Fact | What it means for you |
|---|---|
| Figures are a projection from the latest measurement | If something is unusually busy or quiet in the last 15 minutes, the whole month projection moves with it. Look at trends over several days before deciding. |
| A push under 5 minutes of data is not projected | Too little data to project from, so the figure is stored as sent. |
| Only the latest push is kept for live allocations | The tables on the page show the latest snapshot. Each push replaces the previous one, so there is no per-pod history inside CostGlass. |
| Daily history is kept at namespace level | Each push also writes a daily cost row per namespace, using the run-rate day, plus one for idle capacity when node prices are known. These feed the trend chart. |
| The time-range buttons rescale the current run-rate | The summary and table figures use the latest monthly run-rate multiplied by the length of the range divided by 30 days (for example 7D is 7/30 of a month, 90D is three months). They are not sums of actual past spend. |
Node pricing, idle cost and reconciliation to your bill
OpenCost's pod figures only cover what pods requested. To show what the machines cost (and so what is idle), CostGlass prices each worker node when it can.
| Cloud | How nodes are priced |
|---|---|
| AWS (EKS) | From CostGlass's approximate list-price table for the instance type. |
| Azure (AKS) | From CostGlass's approximate pay-as-you-go price table for the VM size. |
| Linode (LKE) | From Linode's own published plan prices. |
| Google Cloud, Oracle, DigitalOcean and others | No node price source in CostGlass, so nodes are not priced. |
All or nothing. The cluster is priced by its nodes only when every node can be priced. If even one node cannot, the cluster stays "pod-priced": the total is just what OpenCost allocated to pods, and the idle figure is not rebuilt from node prices. CostGlass does not guess a node price.
When all nodes are priced: cluster cost is the sum of node prices; each node's idle cost is its price minus the pods scheduled on it (never below zero); and the cluster efficiency is cost not idle divided by cost.
Reconciliation: the coloured pill under the intro text
Where your cloud billing data is connected, CostGlass compares the Kubernetes node figures with what the cloud actually charged for those nodes. Each cluster gets one pill:
| Pill | Meaning |
|---|---|
| Reconciled to your bill | Every node was found in your billing data. Pod shares are scaled so they add up to the billed node cost. |
| Partly reconciled | Some nodes were matched. Hover the pill to see how many matched and why the rest did not. |
| Estimated at list price | No matching bill data yet, or the cloud does not support matching. The numbers are list-price estimates and the pill says why. |
AWS matching uses EC2 instance IDs in your billing data (CUR with resource IDs). Azure, Google Cloud, Oracle and Alibaba matching also exists, but was written from documentation and sample data and has not been run against a real export from those clouds, so expect "Estimated at list price" for them until proven. Linode and DigitalOcean always stay at list price. Billing data is normally about a day behind. Reconciliation runs automatically after each push; owners and admins can also trigger it through the API.
Page layout and controls
Kubernetes Costs: KPI cards, the Allocate By tabs and controls, the spend trajectory chart and the cost breakdown table.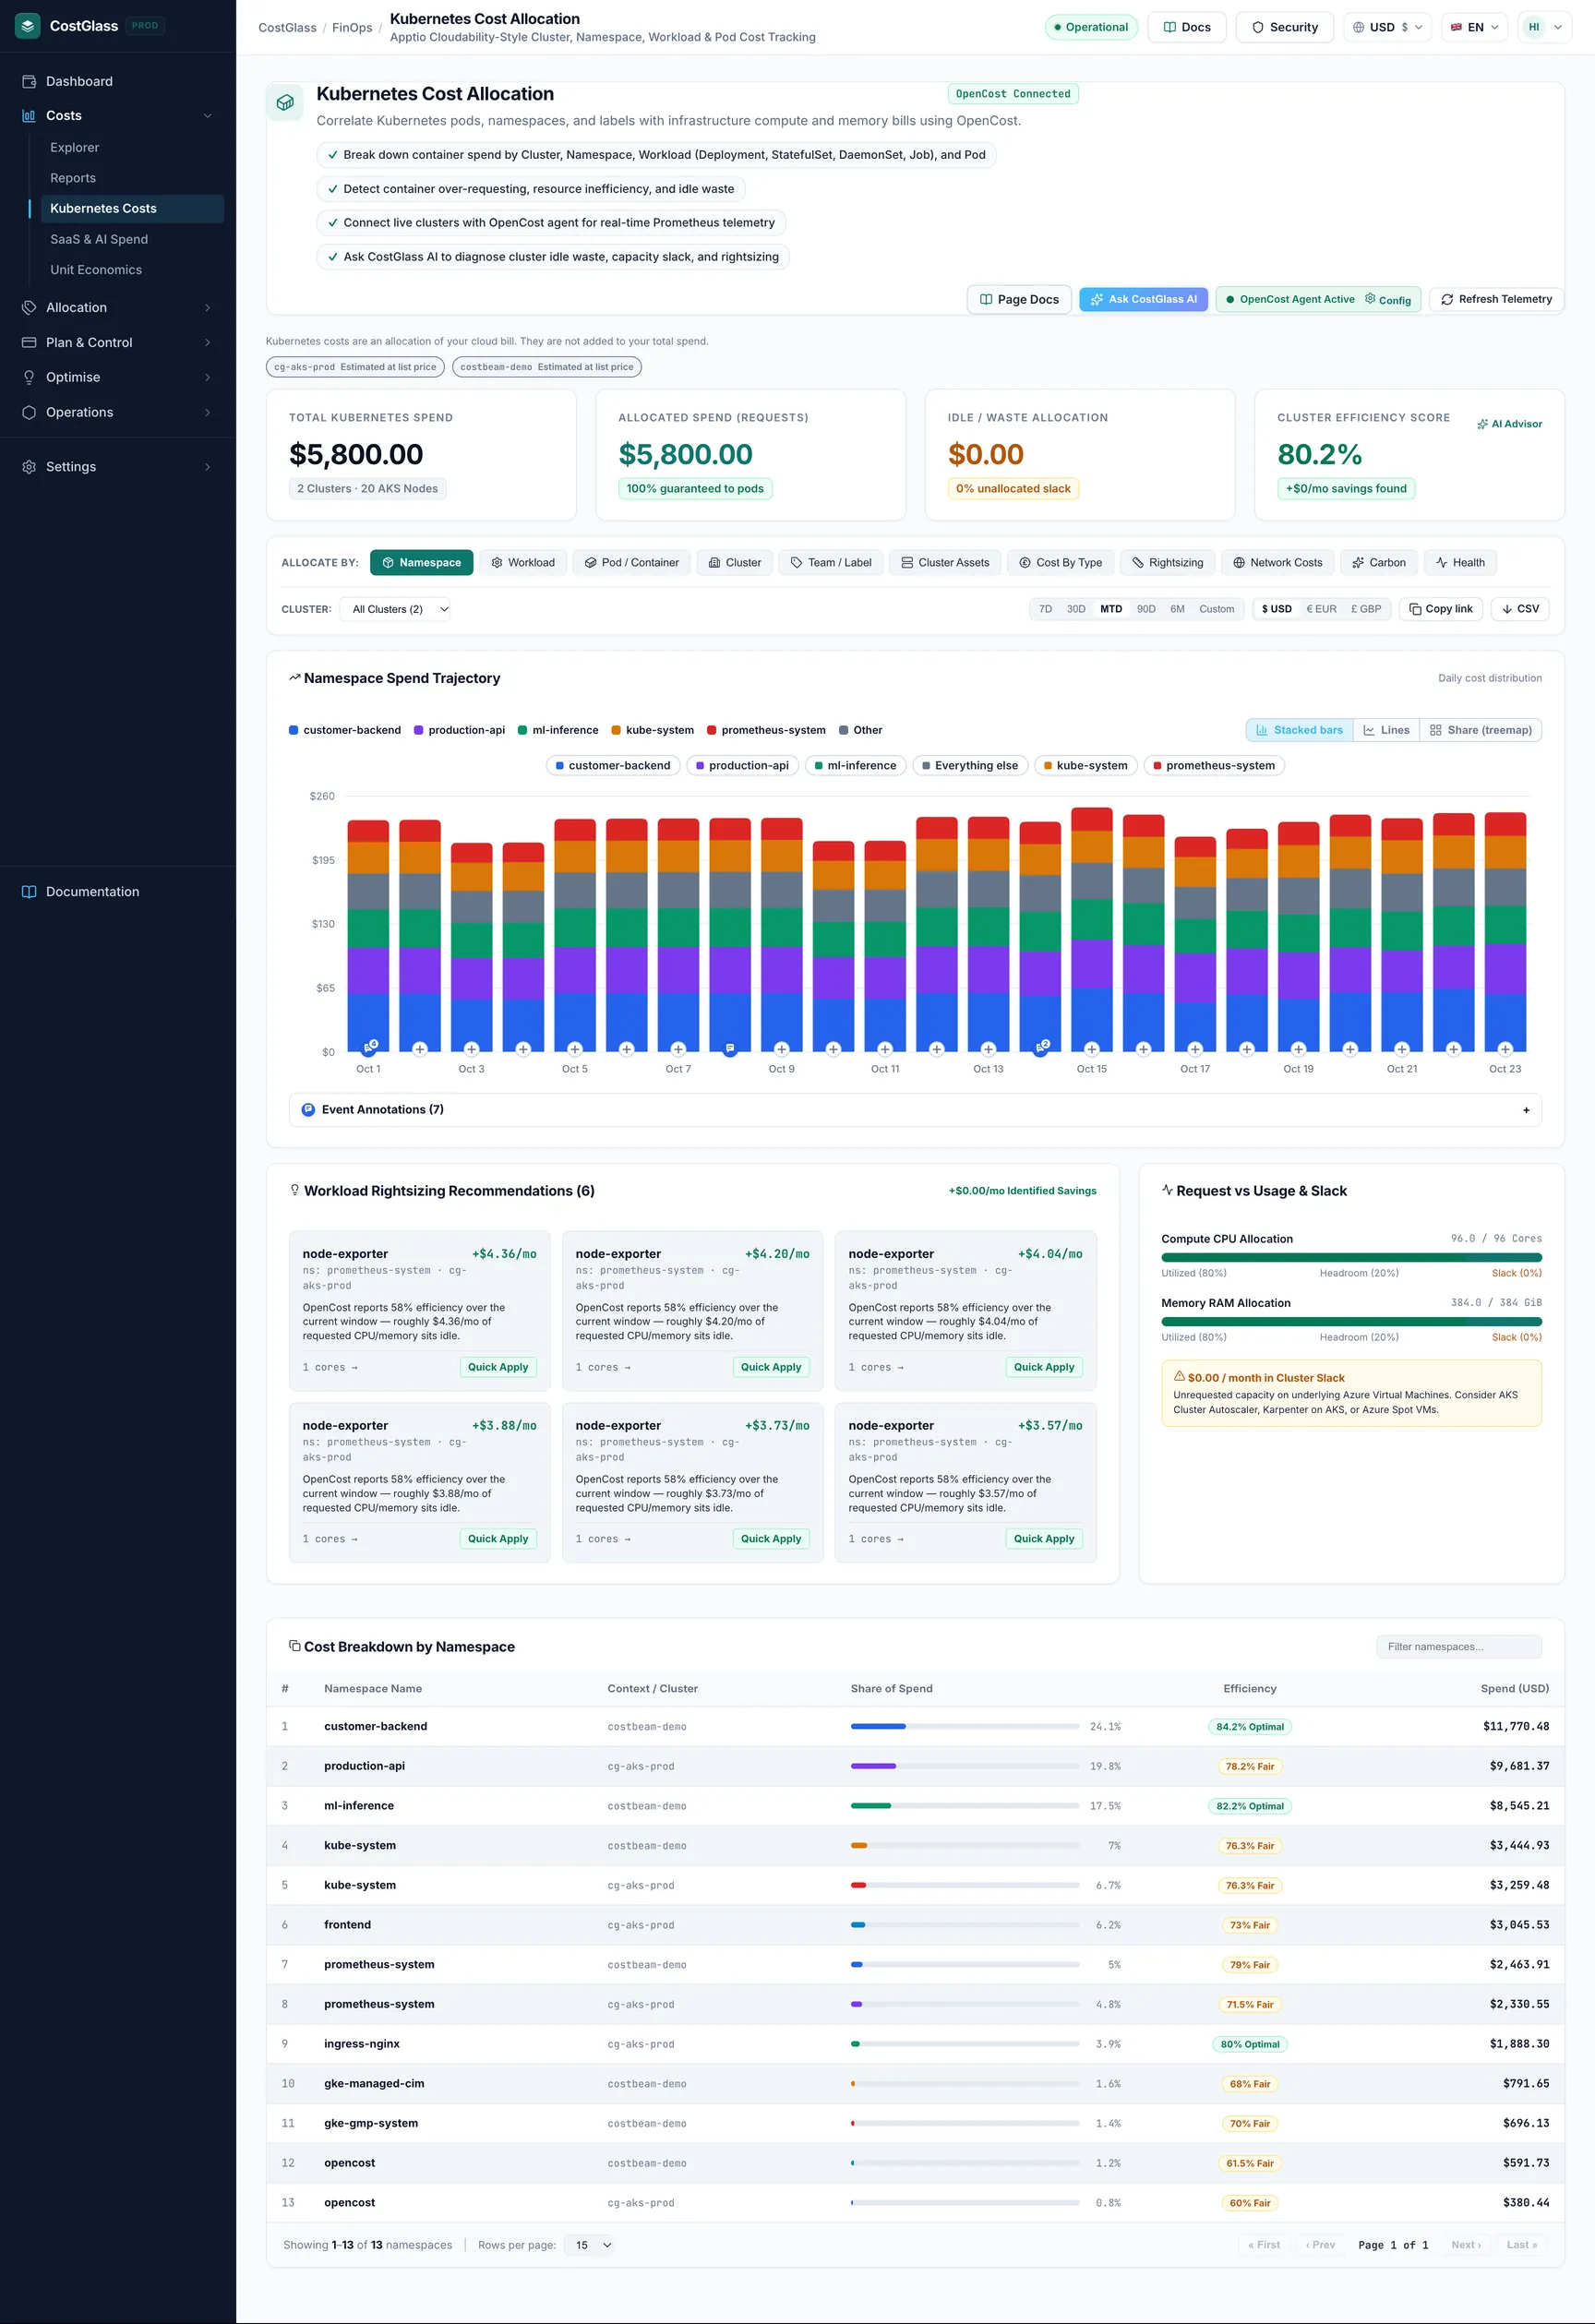
From top to bottom: the header (with Ask CostGlass AI, the connection status and Refresh Telemetry), a one-line reminder that Kubernetes costs are an allocation, a reconciliation pill per cluster, four KPI cards, the controls card, the spend trajectory chart, rightsizing and slack cards, and the main table for the selected tab.
Control reference
| Control | What it does | Options / default |
|---|---|---|
| Allocate By | Chooses how the chart and table are grouped and which view is shown. | Namespace (default), Workload, Pod / Container, Cluster, Team / Label, Cluster Assets, Cost By Type, Rightsizing, Network Costs, Carbon, Health |
| Cluster | Limits everything to one cluster. | All Clusters (default) or any connected cluster |
| 7D / 30D / MTD / 90D / 6M / Custom | Sets the time range used to scale the figures and to draw the chart. | MTD (month to date) by default. Custom shows From and To date boxes and an Apply Range button, with Reset to go back. |
| USD / EUR / GBP | Currency used to show money. | Your organisation's setting |
| Copy link | Copies a link that reproduces this exact view (tab, range, cluster, label key, filters) for anyone in your organisation. | - |
| CSV | Downloads the current table as a CSV file. | - |
| Refresh Telemetry | Re-reads fresh data from CostGlass, ignoring the page's saved copy. | - |
| Group by label key | Only on the Team / Label tab: which Kubernetes label to group cost by. | team (default), app, env, service, component |
| Filter ... box | Free-text filter on the table rows. | Placeholder is "Filter workloads..." or "Filter namespaces..." and so on |
| All kinds | Only on the Workload tab: shows only Deployments, StatefulSets, DaemonSets, Jobs and so on. | All kinds (default) |
| Rows per page | Table page size. | 10, 15, 25, 50, 100 |
| Chart type switcher | Changes the trajectory chart. | Stacked bars (default), Lines, Share (treemap) |
| Connect OpenCost Agent / Config | Opens the connect window with the install commands. After a cluster is connected it is shown as Config. | - |
Saved copy and refresh
To load quickly, the page keeps the last result of each view in your browser for 15 minutes. The page also asks the browser-wide cache for results for up to an hour. Refresh Telemetry skips both and fetches fresh data. The list of connected clusters is always read fresh. New data from the cluster arrives at most every 15 minutes anyway, so refreshing more often than that will show the same numbers.
The four KPI cards
| Card | How it is worked out | How to read it |
|---|---|---|
| Total Kubernetes Spend | Sum of each cluster's monthly run-rate, scaled to the selected range. The line below shows the number of clusters and nodes (labelled EC2 Nodes, AKS Nodes, GKE Nodes and so on by provider). | Your container cost under measurement. It is an allocation and is not added to your total cloud spend. |
| Allocated Spend (Requests) | Total spend minus idle spend. The line below shows the percentage "guaranteed to pods". | Capacity that pods have reserved. High is good: capacity you pay for is claimed. |
| Idle & Slack Capacity | Idle cost summed from the namespace rows, with a percentage of the total. | Capacity nobody has claimed. This is the first place to look for savings. |
| Cluster Efficiency Score | The average of each cluster's efficiency, shown in green from 80%, amber from 60%, red below. The line below shows "+£x/mo savings found", which is 65% of idle cost. | Higher is better. The savings figure is a planning number: some headroom should always stay. It does not appear for clusters that have no efficiency data (a missing score is treated as 75). |
The spend trajectory chart
The chart title follows your tab, for example Namespace Spend Trajectory. It shows daily bars (or monthly for long ranges) split by the grouping you selected, drawn from the daily history CostGlass has recorded. Click a legend item to focus on it, and Clear selection to go back. Switch to Lines to compare trends, or Share (treemap) to see proportions at a glance.
Request vs Usage and Slack
The right-hand card shows two bars, Compute CPU Allocation and Memory RAM Allocation, each split into three parts:
| Colour | Part | Meaning |
|---|---|---|
| Green | Utilized | Capacity pods are really using. |
| Blue | Headroom | Capacity pods reserved but are not using. The gap between request and usage. |
| Amber | Slack | Capacity on the nodes that no pod has reserved. This is the idle share. |
Below the bars, ... / month in Cluster Slack shows the idle cost, with advice that matches your cloud (for example Karpenter consolidation or Spot instances on AWS, Cluster Autoscaler on AKS, GKE and LKE).
The left card, Workload Rightsizing Recommendations, lists workloads whose efficiency is under 60% and whose idle cost is at least $2 a month. Each shows the workload, namespace, cluster, the estimated monthly saving (equal to its idle cost, an upper bound), the reason, and the current CPU request. Its Quick Apply tag is a label only: CostGlass never changes your cluster.
The Allocate By tabs
Namespace, Workload, Pod / Container, Cluster, Team / Label
These five tabs show the main table, Cost Breakdown by ..., with these columns:
| Column | Meaning |
|---|---|
| # | Rank by cost. |
| Name | The namespace, workload, pod, cluster or label value. |
| Context / Cluster | Where it lives: its cluster and, for workloads and pods, its namespace. |
| Kind / Replicas | Workload tab only: Deployment, StatefulSet, DaemonSet, Job and how many replicas. |
| Node Target | Pod tab only: the node the pod runs on. |
| Share of Spend | Its percentage of the total for this view, with a bar. |
| Efficiency | Used versus requested. Shown as a badge: Optimal from 80%, Fair from 60%, Waste Alert below 60%. |
| Cost | Its monthly run-rate (for the selected range). |
Team / Label groups by a Kubernetes label you choose. The label keys offered are team, app, env, service and component. Cost under a label value is only as good as your labelling: anything without the label is grouped separately. The exporter sends the app, env and team labels, so those three are the ones most likely to have data.
Cluster Assets
Shows Infrastructure Assets Breakdown: summary tiles (Total Asset Spend, Compute Nodes, Provider & Region, Cluster Efficiency) and a table withComponent Kind, Name / Identifier, Cluster, Specification / Details, State, Cost Basis and Monthly Cost. This is the view where node prices and the control plane show up. The Cost Basis column says how each price was obtained, for example a list price table.
Cost By Type
Splits cost into CPU, RAM, Storage, Network, Load Balancer, GPU, Shared, External and Idle, grouped by namespace, workload or cluster (switch at the top of the card). A zero is a real zero, not a missing value. Use it to see whether cost is driven by compute, storage or something unexpected like load balancers.
Rightsizing
Request vs Usage (Rightsizing) shows, per workload, CPU Request / Usage and Memory Request / Usage next to Monthly Spend, with a filter box. Usage is OpenCost's average over its measured window, so it appears only once Prometheus has collected enough history. If a workload shows nothing, it has not reported usage yet; the page does not invent a figure. AI Rightsizing Insights asks CostGlass AI to review the table.
Network Costs
Splits network cost into Cross-Zone, Cross-Region, Internet Egress and Other. OpenCost reports these only when network cost allocation is turned on in OpenCost inside your cluster. That is a setting in your OpenCost deployment that CostGlass cannot change for you, so the tab may be empty until you enable it. Cross-zone and egress traffic is often a hidden cost: services that talk across availability zones can be moved closer together.
Carbon
Carbon Emissions shows kilograms of CO2e. It comes from OpenCost's own carbon estimates (which use Cloud Carbon Footprint coefficients for your cloud, region and instance type), not a CostGlass estimate. OpenCost reports carbon per machine and disk, so CostGlass sums it for each cluster. There is no namespace or pod split.
- The exporter measures a one-hour window. Projected Monthly CO2e is that hourly figure multiplied up (daily is hourly times 24, monthly is times 720). It is a projection, not a measured total.
- A cluster that has never reported carbon shows not reported, never 0. That means OpenCost has no carbon data for it, usually because the carbon option was not turned on.
- The small bar chart Daily CO2e Trend (projected) shows the history of those projections.
Health
Cluster Health uses a direct read of the Kubernetes API (this is why the optional RBAC is needed), because cost data has nothing about pod health. Each cluster gets a score out of 100 using a published formula:
| Item | Effect on the score |
|---|---|
| Failed pods (including pods stuck in CrashLoopBackOff or ImagePullBackOff) | Minus 50 times the share of pods that are failed |
| Pending pods | Minus 15 times the share of pods that are pending |
| Nodes not Ready | Minus 25 times the share of nodes not ready |
| Recent restarts | Minus the number of recent container restarts, up to 10 |
| Pending storage claims | Minus 2 for each, up to 10 |
The overall score is the average of the clusters that reported. Colours: green from 90, amber from 70, red below. Each cluster line shows pods healthy out of total, failed, pending, nodes ready, recent restarts and pending storage claims. Kubernetes only keeps a running total of restarts, so recent restarts is the increase since the previous push (never negative; a recreated pod resets its own counter).
Making decisions from the page
| What you see | What it usually means | What to do |
|---|---|---|
| High Idle %, with low efficiency | Nodes are bigger or more numerous than the pods need. | Reduce node count or node size, use a cluster autoscaler or consolidation tool, and consider Spot or preemptible capacity for tolerant workloads. |
| A workload with large Headroom (request far above usage) | Requests were set generously and never tuned. | On the Rightsizing tab, lower the CPU and memory requests step by step toward actual usage plus a safety margin, and watch for throttling or out-of-memory restarts. |
| Efficiency under 60% on a workload that costs little | Not worth your time. | Sort by cost and tackle the biggest idle cost first. |
| A workload at 10% efficiency or lower | Possibly abandoned or no longer needed. | Check with its owner and remove it if it is not needed. CostGlass flags these in Savings. |
| Many half-empty nodes | The scheduler cannot pack pods tightly (spread rules, large requests). | Look at bin-packing: smaller requests, fewer spread constraints, or different node sizes. |
| Spend that jumps between days | Run-rate sensitivity, a scaling event or a deployment. | Compare days on the chart before concluding; use Cost Explorer and the anomaly page for real billed changes. |
| Cross-zone or egress cost | Chatty services spread over zones or regions. | Place related services in the same zone where reliability allows. |
| Health score dropping, many restarts | Pods crashing, nodes not ready or storage not binding. | Investigate with kubectl before cutting resources: do not rightsize unhealthy workloads. |
Budgets, Savings and Reports
- Budgets. You can create a budget for Kubernetes (OpenCost), scoped to all clusters or one cluster, and optionally one namespace. OpenCost overwrites its figures on every push, so there is no month-to-date total. The budget is therefore judged on the projected month, and the card says "tracked on projected run-rate". See Budgets.
- Savings. The savings page can list Kubernetes recommendations built only from OpenCost's own figures: workloads at or below 10% efficiency (saving is the whole workload cost), over-requesting workloads (saving is the reported idle cost, an upper bound), and cluster slack (an estimate that assumes half of the slack can be reclaimed, stated on the card). Kubernetes savings are grouped with the host cloud bill so the same money is not counted twice. See Savings.
- Reports.Reports can group by Kubernetes Namespace (OpenCost) and has an Include Kubernetes OpenCost Allocations switch. This reads the latest snapshot only, so it has no previous period to compare. Saved filters do not apply to Kubernetes namespace allocations.
Worked recipes
- Open Kubernetes Costs and choose Namespace under Allocate By. Set the range to MTD.
- Check the reconciliation pill. If it says Reconciled to your bill, shares are scaled to what the cloud billed for the nodes. Otherwise they are list-price estimates.
- Note that Idle is not owned by any team. Decide a policy: spread it in proportion to each team's share, or keep it as a platform cost.
- Click CSV and send the table to finance. For a repeatable report, use Reports with the Kubernetes Namespace grouping.
Remember the figures are a run-rate. For month-end numbers that must tie to an invoice, base them on your cloud bill.
- Choose the Workload tab and look at the Efficiency column. Click through to see the lowest values.
- Open the Rightsizing tab for the CPU and memory request against usage of those workloads.
- For each, compare the gap in cost terms using the Monthly Spend column, and start with the largest.
- Lower requests towards usage plus a margin, redeploy, then check again after a week.
- Choose Cluster and read Idle & Slack Capacity and the efficiency score.
- Open Cluster Assets to see the nodes and what each costs.
- If idle is large and stable, remove or resize nodes. If it follows a daily pattern, use autoscaling.
Honest limits
- Figures are a monthly run-rate projected from about 15 minutes of measurement, not measured monthly spend.
- Live allocations are one snapshot. There is no per-pod history inside CostGlass; only the daily namespace-level and idle history exists.
- Node prices exist only for AWS, Azure and Linode. For Google Cloud, Oracle and others, nodes are not priced and clusters are pod-priced (no node-based idle).
- AWS and Azure node prices come from approximate in-product tables, not your actual rates (reservations, Savings Plans and discounts are not applied unless the cluster is reconciled).
- Reconciliation to the bill is tested for AWS; for Azure, Google Cloud, Oracle and Alibaba it has not been confirmed against real exports, and Linode and DigitalOcean are not reconciled.
- Carbon is a projection from a one-hour window. It is reported per cluster only.
- Network costs depend on a setting in your OpenCost deployment. Usage figures need Prometheus history.
- Health needs the optional read-only RBAC.
- CostGlass reads and reports. It never changes your cluster.