Finding your way around
A tour of the sidebar, top bar and page controls: what every page answers, plan gating, currency, language, links and caching.
Finding your way around
A walk through the sidebar group by group, then the top bar and the small controls that save you time: currency, language, links, refresh and CostGlass AI.
- The sidebar is organised by the job you are doing: Costs (understand), Allocation (ownership), Plan & Control (guardrails), Optimise (save), Operations (running services) and Settings (setup and admin).
- Menu items with a padlock belong to a higher plan. Click one to see which plan unlocks it.
- The top bar holds the Security button, the currency selector, the language selector and your user menu.
- The address bar of Cost Explorer and Reports follows what you select, so you can copy it to share the exact view.
- Heavy pages are cached in your browser for an hour. Use a page's Refresh button to force fresh data.
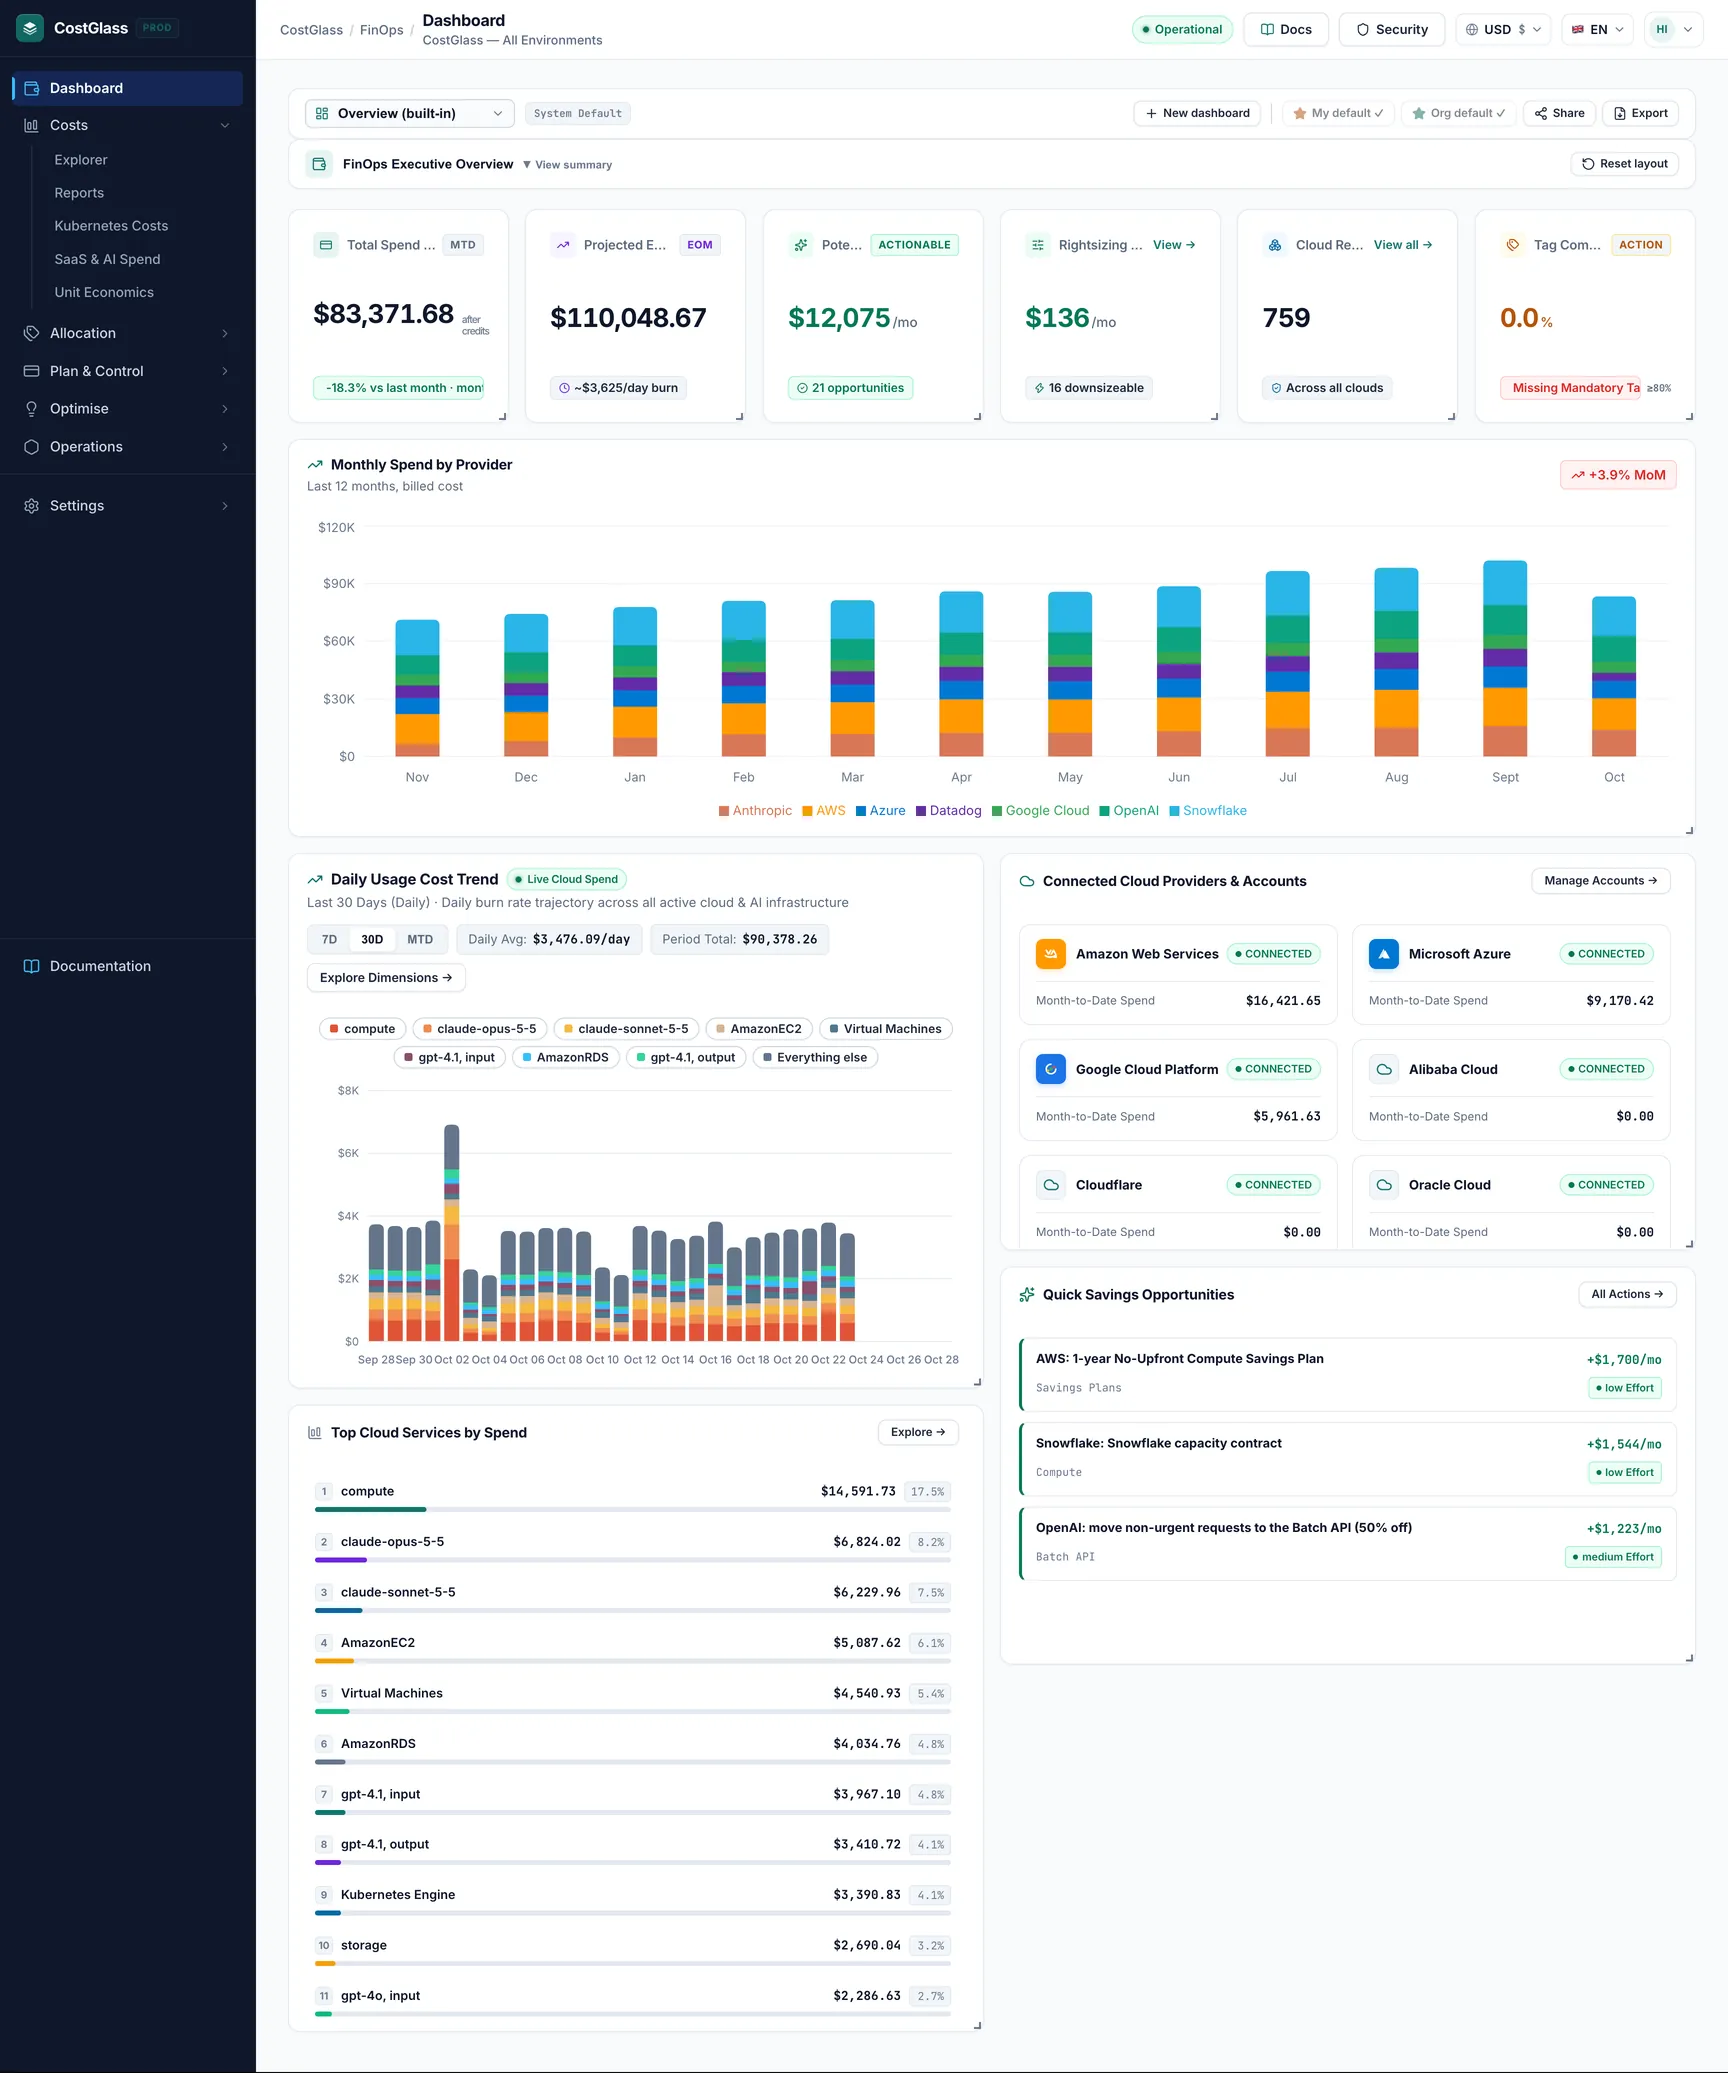
The layout at a glance
- Sidebar (left). The groups are collapsible: click a group name to open or close it. The group that contains the page you are on opens by itself.
- Top bar. Shows a breadcrumb and the page title, then Security, the currency selector, the language selector and your user menu.
- Content. The page itself. Most pages start with a header that says what the page is for, then the controls, then the data.
- Documentation. The book icon at the foot of the sidebar opens these docs.
The sidebar, group by group
Dashboard
A single item at the top. Dashboard is your landing page: month-to-date spend, projected month-end, savings, resource count, tag compliance, a daily trend and your connected clouds. It also hosts your custom dashboards. See Dashboards.
Costs: understand where the money goes
| Page | What it answers | Guide | Plan |
|---|---|---|---|
| Explorer | Slice spend by service, account, region or tag across every cloud, filter by cloud, and compare periods. | Guide | All plans |
| Reports | Ready-made and custom reports with two grouping dimensions, a library of saved reports and scheduled delivery. Export to Excel, CSV or PDF. | Guide | All plans |
| Kubernetes Costs | Cost of your clusters by namespace, workload, pod or label, plus carbon and cluster health. | Guide | Growth and above |
| SaaS & AI Spend | Spend with OpenAI, Anthropic, Datadog and Snowflake, and the connections for them. | Guide | All plans |
| Unit Economics | Cost per unit of business output, such as per customer or per thousand requests. | Guide | All plans |
Allocation: who owns the spend
| Page | What it answers | Guide | Plan |
|---|---|---|---|
| Tag Explorer | Spend grouped by a tag key such as team or environment, using what each cloud billed. | Guide | All plans |
| Tag Compliance | Which resources are missing the tags your policy requires. | Guide | All plans |
| Virtual Tagging | Assign spend to teams or products with rules, without changing anything in the cloud. | Guide | Growth and above |
Plan & Control: guardrails
| Page | What it answers | Guide | Plan |
|---|---|---|---|
| Forecasting | Where will this month and next month end up, and what if we add resources? | Guide | All plans |
| Budgets & Alerts: Budgets | Are we within the limits we set? | Guide | All plans |
| Anomalies | Which costs jumped unexpectedly, why, and who gets told? | Guide | All plans |
| Budgets & Alerts: Cost alerts | Rules that fire when spend rises period over period. | Guide | All plans |
| Alert Rules | The overall alert rules and alert history. | Guide | All plans |
| Issues | A shared list of cost problems with assignees, created from anomalies and budget alerts. | Guide | All plans |
Optimise: reduce the bill
| Page | What it answers | Guide | Plan |
|---|---|---|---|
| Savings | A prioritised list of actions that should cut spend, each with how its figure was reached. | Guide | All plans |
| Rightsizing | Which machines and databases are bigger or smaller than their measured use needs. | Guide | All plans |
| Commitments | Reserved Instance and Savings Plan coverage, utilisation and expiry. | Guide | Growth and above |
| Instance Scheduler | Switch non-production EC2 instances and Auto Scaling groups off outside working hours. | Guide | Growth and above |
Operations: running services
| Page | What it answers | Guide | Plan |
|---|---|---|---|
| Ops Overview | A cockpit with services online, discovered assets, open incidents and your support requests. | Guide | All plans |
| Cloud Resources | The inventory of everything CostGlass found in your clouds. | Guide | All plans |
| Uptime | Health checks on your public endpoints and who is alerted. | Guide | Growth and above |
| Incidents | Open production incidents recorded for your organisation. | Guide | Growth and above (server-side) |
| Support & Requests | Raise a request, bug report or question with CostGlass engineers and track it. | Guide | Growth and above (server-side) |
Settings: setup and administration
The Settings group is at the bottom and has three sub-headings.
| Heading | Page | What it is for | Guide |
|---|---|---|---|
| Connections | Cloud Accounts | Connect and manage clouds, vendors and Kubernetes clusters. | Guide |
| Connections | FOCUS 1.0 | Your multi-cloud billing data in the FOCUS standard, exportable as CSV. | |
| Connections | CUR Export | The AWS Cost and Usage Report connection that feeds AWS costs. | AWS guide |
| Organisation | Hierarchy | Draw your business units and teams and map accounts to them. | Guide |
| Organisation | Team | Invite people and manage roles. | Guide |
| Organisation | API Keys | Keys for scripts and AI assistants. | Guide |
| Organisation | Single sign-on | Sign in with your company identity provider (Scale and above). | Guide |
| Organisation | Data Residency | Your fixed region and data retention. | Guide |
| Organisation | Audit Log | Who changed what, for owners and admins. | Guide |
| Account & Billing | Notifications | Your spend summaries and where they are sent. | Guide |
| Account & Billing | Billing & Plans | Your plan, card, invoices and upgrades. |
Back Office (only for CostGlass staff)
If you see an extra amber Back Office section, your account is a CostGlass platform operator. Customers do not have it.
Plan gating: greyed-out items
A menu item your plan does not include is greyed out with a padlock beside it. Clicking it does not open the page; it shows a message such as Available on the Growth, Scale, Enterprise plans.
| Item | Minimum plan |
|---|---|
| Kubernetes Costs, Virtual Tagging, Commitments, Instance Scheduler, Uptime | Growth |
| Single sign-on | Scale |
The top bar
Currency selector
The globe button with a code such as USD $ chooses how money is shown: US dollars, euros or pounds. It changes the display only: amounts are stored in the provider's currency and in dollars, and converted at a live exchange rate when shown. Your choice is remembered in your browser and applies to Cost Explorer, Reports and the Dashboard. See the glossary in Welcome.
Language selector
Choose English, Spanish, German or French. Not every page and message is translated yet, so you will still see some English text. The language is remembered in your browser. These guides are written in English.
Security and the status pill
Security opens the security architecture page. The green Operational pill sits in the sidebar, just above Documentation, and is a static indicator.
User menu
Your name opens a menu with My Profile, Cloud & Settings (which goes to Cloud Accounts) and Logout. It also shows your organisation and role.
Search
There is no global search box in the top bar. Search is local to a page: Cloud Resources, Reports and others have their own search box and filters, and the documentation has its own search.
Light and dark themes
CostGlass uses one dark theme. There is no light/dark switch.
CostGlass AI
CostGlass AI is the built-in assistant. It appears as a button on Cost Explorer, Reports, Anomalies, Forecasting, Savings, Kubernetes Costs and Cloud Accounts. Click it to open a side panel.
- On each page it analyses what you are looking at and answers questions in plain English. On Cloud Accounts it helps diagnose a connection that is stuck.
- On Cost Explorer it can also suggest filters; you choose whether to apply them.
- Anything it says about amounts comes from your own data. Treat it as a helper, and check important figures on the page itself.
- Each organisation has a daily allowance of AI requests. If it is used up you will be told and it resets the next day.
Copying links to a view (permalinks)
Cost Explorer and Reports write your selections into the address bar as you work, for example the grouping, date range, filters and currency. Copy the address and send it, and a colleague in your organisation opens the same view. The Reports and Cloud Resources pages also have a Copy link button.
- A link contains no password, token or organisation id. It only works for signed-in users of the same organisation.
- Nothing is stored on a server: the link just describes the view. If someone opens it while signed out, they land on the sign-in page and the link is lost.
- Settings that match the defaults are left out, so the address stays short.
Browser cache and Refresh
To keep pages quick, CostGlass remembers the answers for the heavy read-only pages in your browser for one hour. This covers the Dashboard, Cost Explorer, Reports, Kubernetes Costs, Unit Economics, Forecasting, Savings, Rightsizing, Instance Scheduler and Cloud Resources.
- A different selection (a new filter, a new date range) is fetched fresh the first time, then remembered.
- Anything you change (connecting an account, running a sync, applying a recommendation, changing a schedule) clears the remembered answers, so your own changes show immediately.
- Changes made elsewhere, such as by a teammate or a background sync finishing, can take up to an hour to show up. Use the page's Refresh button (Cost Explorer has one; Cloud Resources has Refresh Inventory) to fetch fresh data straight away.
- Each user has their own cache; signing out clears it.