Reports
Build, compare, export, save and schedule spend reports, with presets, Excel, CSV and PDF exports.
Reports
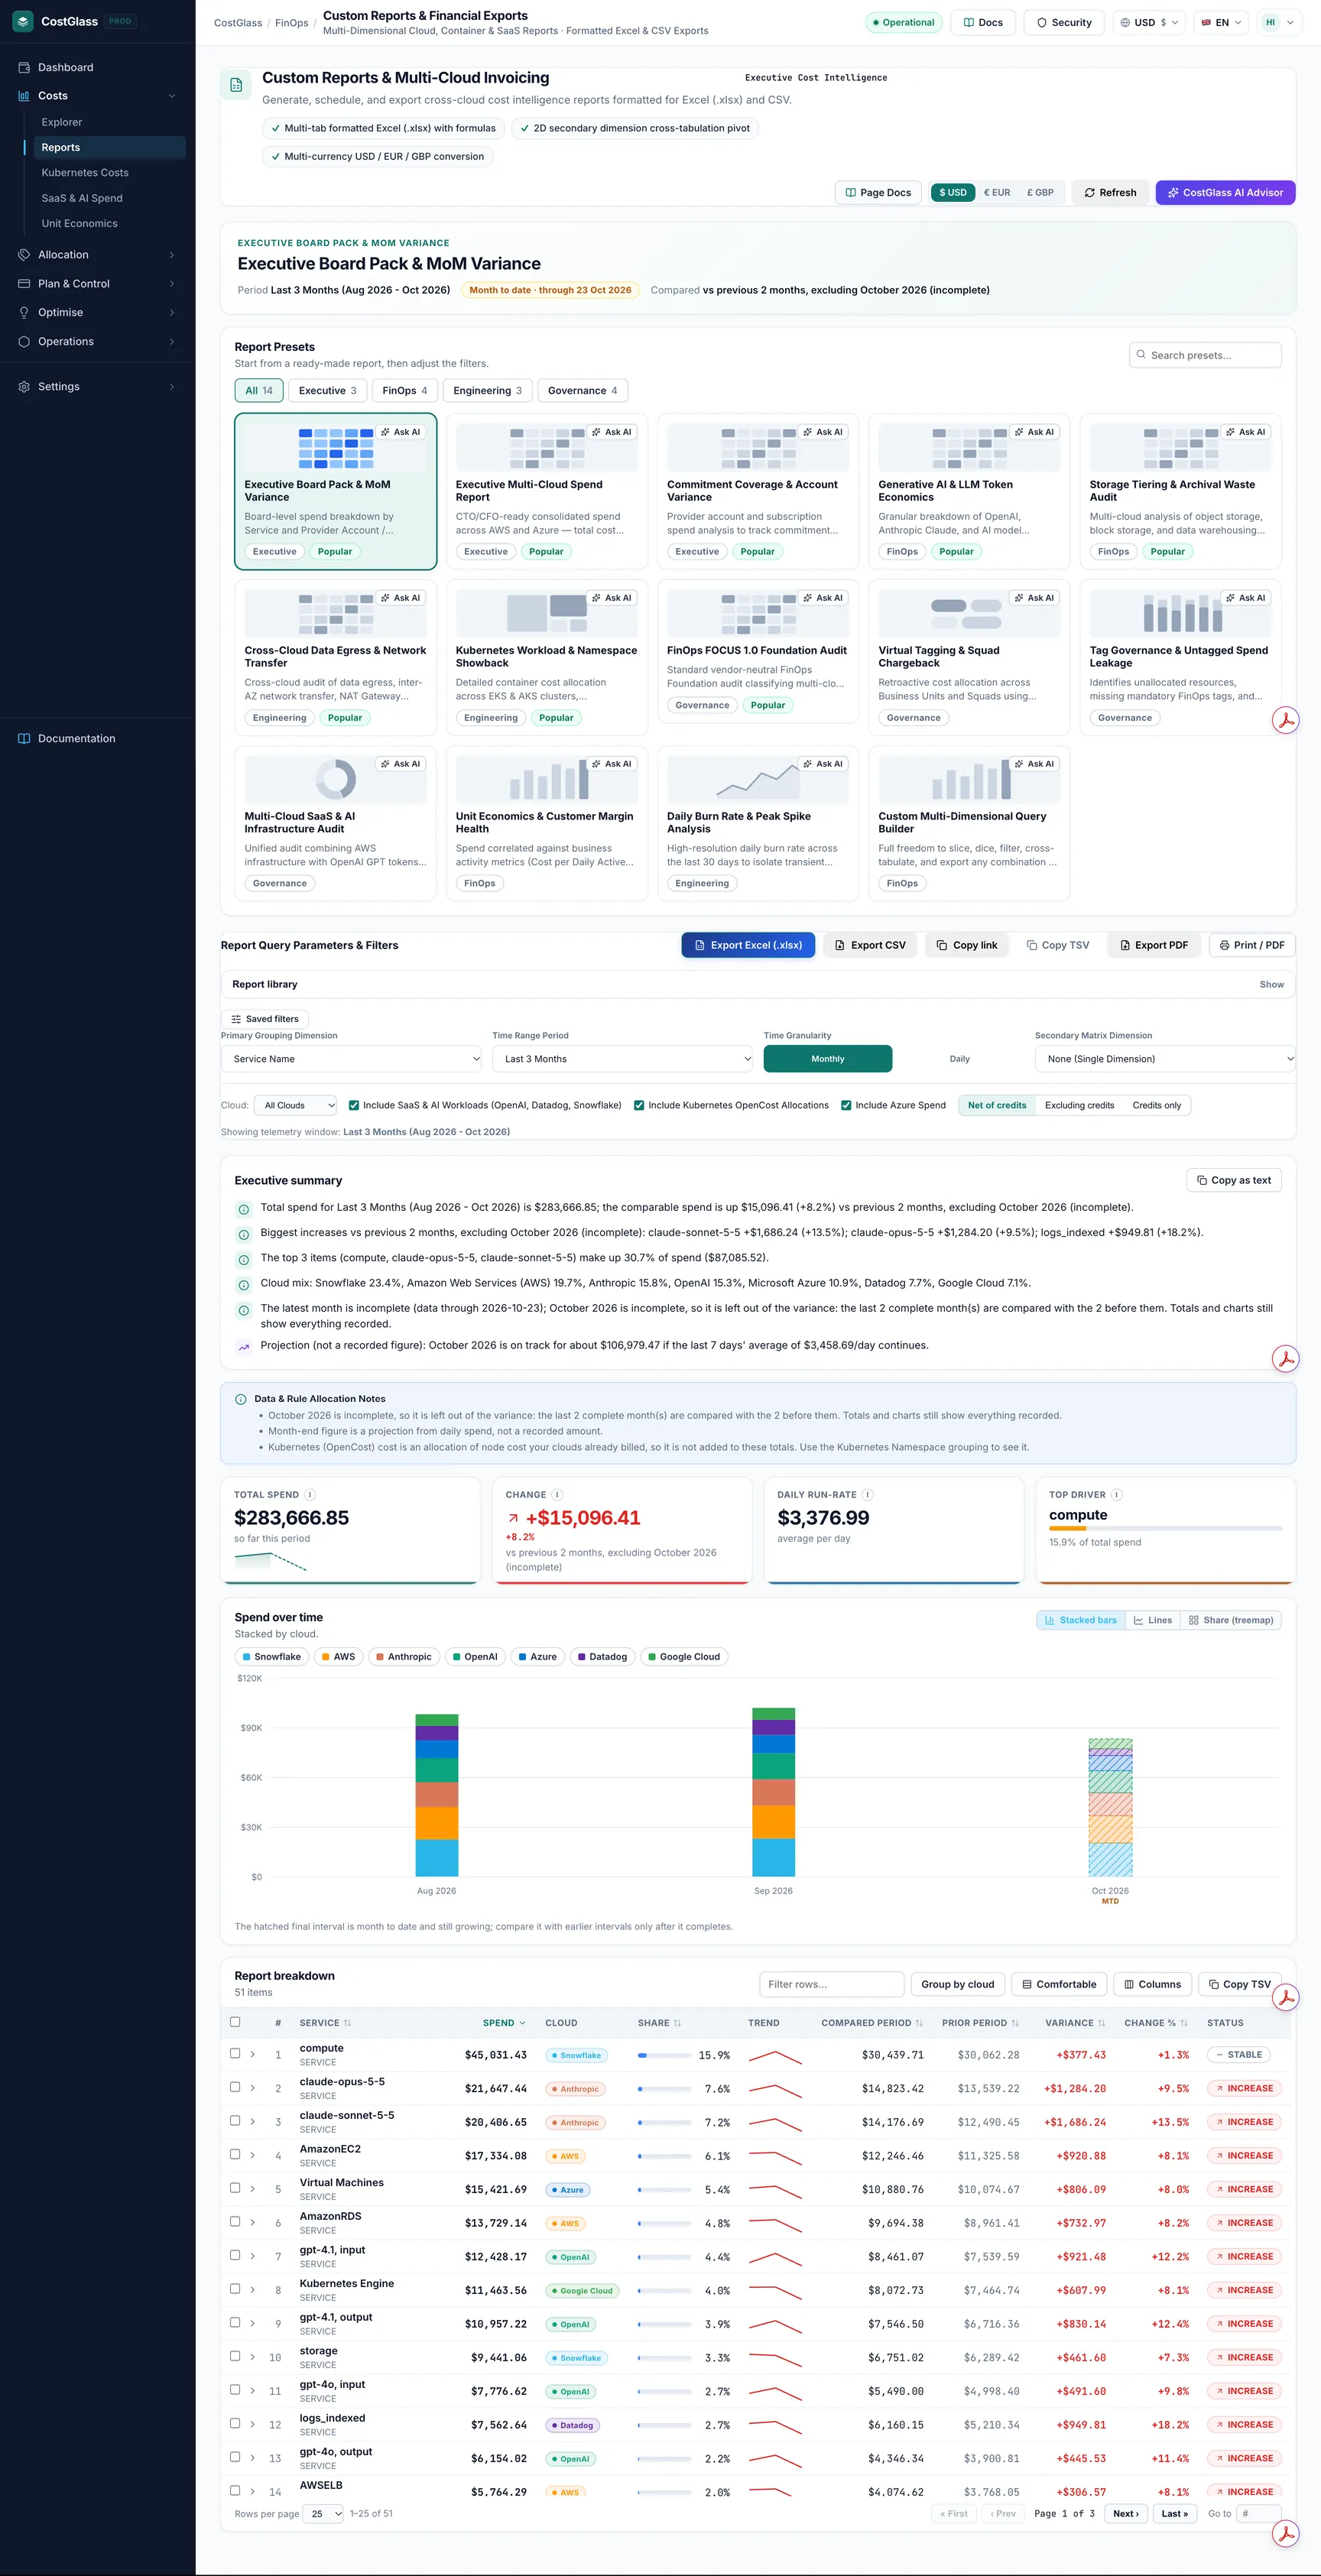
Build a spend report for a chosen period, compare it with the period before, and share it as Excel, CSV, PDF, a printed page, or a schedule that arrives by email.
- A report is one question answered as a table and a chart: how much did we spend, grouped by what, over which period, and how does that compare with before?
- Start from one of the 14 presets in the gallery, or build your own with a primary grouping, an optional second grouping, a time range, filters and a currency.
- CostGlass compares fairly. If the last month is not finished yet, it either leaves that month out of the comparison or compares it with the same number of days of the month before. The page always says which.
- Export to Excel, CSV or PDF, print the page, copy a link to the exact view, or save the report and have it emailed on a schedule.
- Every figure comes from the cost records CostGlass has stored. Nothing is estimated except one clearly labelled projection.
What Reports is for
Reports turns your stored cost data into something you can hand to someone else: a board pack, a monthly review for finance, a showback for an engineering team, or a quick check on one cloud. It is built around comparison and sharing: every row says whether it went up, went down or stayed the same, and every report can leave CostGlass as a file, a printed page, a link or an email.
The two share the same data, so numbers agree when the filters and period agree. Each row in a Reports table also has an Open in Cost Explorer link when the row can be expressed there, so you can move from a finished report into exploring one line.
Before you begin
- At least one cloud (or SaaS / AI vendor) connected and synced, so that cost records exist. An empty report says "No cost records for this report".
- Some clouds only report monthly totals. They appear in monthly reports but are left out of daily ones; the page tells you which (see "Data notes" below).
- To save reports, schedule emails or share them you need to be signed in. Scheduled emails go only to active members of your own organisation.
- If your account is limited to one part of your organisation (a hierarchy node), reports only ever show the accounts you can see.
Preset gallery
The Report presets card lists ready-made reports. Use the search box (Search presets...) or the category buttons (All, Executive, FinOps, Engineering, Governance) to narrow it down. A Popular tag marks the presets we recommend starting with. Click a card to load it: the page fills in the grouping, period and toggles and runs the report straight away. The Ask AIbutton on a card opens CostGlass AI and asks it to explain that preset.
| Preset | The question it answers | Grouping and period | Notes |
|---|---|---|---|
| Executive Board Pack & MoM Variancebr/>Executive, Popular | Where did we spend over the last quarter, in which accounts, and how does it compare with the quarter before? | Service by Provider Account / Subscription. Last 3 months, monthly. | Includes SaaS and AI vendors and Azure. |
| Executive Multi-Cloud Spend Reportbr/>Executive, Popular | What is the consolidated multi-cloud picture for a CTO or CFO: trend, split by cloud, top services and accounts? | Service by Provider Account / Subscription. Last 6 months, monthly. | SaaS and AI vendors are switched off; Azure is on. Turn the SaaS toggle on to include vendors. |
| Commitment Coverage & Account Variancebr/>Executive, Popular | Which accounts changed most over six months, so I can see where Savings Plans, reservations or committed use discounts had an effect? | Provider Account / Subscription by Service. Last 6 months, monthly. | This report shows spend by account. It does not measure commitment coverage itself: use the Commitments page for that. |
| Generative AI & LLM Token Economicsbr/>FinOps, Popular | How much are we spending on AI models across OpenAI, Anthropic, Bedrock, Azure OpenAI and Vertex AI? | Service by Provider Account / Subscription. Last 3 months, monthly. | Narrowed to AI spend (OpenAI and Anthropic, plus services whose name matches gpt, claude, bedrock, vertex or sagemaker). It reports billed cost. Token counts live on the SaaS & AI Spend page. |
| Storage Tiering & Archival Waste Auditbr/>FinOps, Popular | Which storage services cost the most, and in which regions? | Service by Region. Last 3 months, monthly. | Narrowed to services whose name matches storage, s3, blob, ebs, disk, backup or archive. |
| Cross-Cloud Data Egress & Network Transferbr/>Engineering, Popular | How much do we pay for networking and data transfer, and where? | Service by Region. Last 3 months, monthly. | Narrowed to services whose name matches network, vpc, transit, gateway, nat, bandwidth, egress, data transfer, route53, dns, elb or load balancer. |
| Kubernetes Workload & Namespace Showbackbr/>Engineering, Popular | Which Kubernetes namespaces use the most of the node cost we already pay? | Kubernetes Namespace. Month to date, monthly. | Uses the latest OpenCost snapshot, so it has no previous period to compare with (see below). Needs OpenCost connected. |
| FinOps FOCUS 1.0 Foundation Auditbr/>Governance, Popular | How is spend split into the standard FOCUS charge categories: Usage, Purchase, Tax, Credit and Adjustment? | Charge Category (FOCUS) by Service. Last 3 months, monthly. | Useful to see how much of a bill is real usage and how much is tax, credits or commitment purchases. |
| Virtual Tagging & Squad Chargebackbr/>Governance | How much does each team, squad or business unit cost, using our own allocation rules? | Virtual Tag. Month to date, monthly. | Needs at least one virtual tag with rules. See Virtual Tagging. |
| Tag Governance & Untagged Spend Leakagebr/>Governance | How is the last 30 days of spend spread across accounts? | Provider Account / Subscription, daily. Last 30 days. | Shows spend by account. It does not list untagged resources itself: use Tag Compliance for that. SaaS vendors are off. |
| Multi-Cloud SaaS & AI Infrastructure Auditbr/>Governance | How does spend divide between each cloud and each SaaS or AI vendor? | Multi-Vendor SaaS & AI Provider. Last 3 months, monthly. | Despite the name, every connected provider appears as a row, clouds and vendors alike. |
| Unit Economics & Customer Margin Healthbr/>FinOps | What are our biggest services over six months? | Service. Last 6 months, monthly. | This is service spend only. Cost per business unit is on Unit Economics, which needs your own volumes. |
| Daily Burn Rate & Peak Spike Analysisbr/>Engineering | On which days did spend spike, and is there a weekend dip? | Service, daily. Last 30 days. | Clouds that only report monthly totals are left out of daily views. |
| Custom Multi-Dimensional Query Builderbr/>FinOps | Anything else: a blank slate to slice any way you like. | Service. Last 3 months, monthly. | Everything switched on. This is also the preset the page becomes when you change the grouping or period by hand. |
Build a custom report
Under Report Query Parameters & Filters the controls run the report as soon as you change them. The line Showing telemetry window at the bottom right confirms the exact period used.
Primary grouping options
| On-screen label | What each row is | Good for |
|---|---|---|
| Service Name | A cloud service such as a compute or storage product, or a vendor product. | The default view of where money goes. |
| Provider Account / Subscription | An AWS account, Azure subscription, Google project and so on. Shown by display name where CostGlass knows it. | Showback per account; spotting a new account. |
| Region | A location. CostGlass normalises region codes from different clouds into one place name (for example AWS eu-west-2, Azure uksouth and Google europe-west2 all read "London"), so the same place on two clouds is one row. | Residency checks and cross-region transfer. |
| Usage Meter | The billing SKU where the cloud supplies one, otherwise the service name. | Finer detail below service level. |
| Usage Type | The same SKU-or-service value as Usage Meter. | As above. |
| Charge Category (FOCUS) | Usage, Purchase, Tax, Credit or Adjustment. | Separating real usage from tax, credits and commitment purchases. |
| Kubernetes Namespace (OpenCost) | A namespace from your OpenCost data. | Team showback inside a cluster. See below. |
| Virtual Tag / Squad Allocation | A value of one of your virtual tags. A second picker, <UI>Virtual Tag Dimension</UI>, chooses which tag. | Chargeback by team or product using your own rules. |
| Multi-Vendor SaaS & AI Provider | A provider: each cloud and each SaaS or AI vendor. | How the bill divides between clouds and vendors. |
Time range and granularity
| Time range | What it covers | Daily by default? |
|---|---|---|
| Last 7 Days (Daily) | A rolling window ending today. | Yes |
| Last 30 Days (Daily) | A rolling window ending today. | Yes |
| Month to Date (MTD) | From the 1st of this month to today. | Yes |
| Last Month | The whole of the previous calendar month. | Yes |
| Last 3 Months | The current month and the two before it. | No, monthly |
| Last 6 Months | The current month and the five before it. | No, monthly |
| Last 12 Months | The current month and the eleven before it. | No, monthly |
| Year to Date (YTD) | From 1 January to now. | No, monthly |
| Custom Date Range | Exactly the days you choose. | Yes, daily |
Picking a time range selects a sensible granularity for you, because a one-month range shown monthly is a single bar. You can still switch it by hand.
Rules for a custom date range
- Picking Custom Date Range fills the last 30 days to start with and switches to Daily.
- Both From and To are needed. Until both are set, the report does not run and the page says Pick both dates to run the report.
- The start date must be on or before the end date, otherwise you see The start date must be on or before the end date.
- Neither date can be in the future.
- The comparison period is the same number of days immediately before your range.
- If you switch a custom range to Monthly, the report counts whole calendar months that start inside your dates. A data note tells you so. For an exact day range, stay on Daily.
Filters, toggles and currency
| Control | What it does |
|---|---|
| Cloud | Appears once CostGlass knows which providers you have. All Clouds or one cloud. Choosing one cloud scopes the whole report to it and disables the Azure and SaaS toggles, because they no longer apply. |
| Include SaaS & AI Workloads (OpenAI, Datadog, Snowflake) | Includes or leaves out the SaaS and AI vendors in totals and tables. |
| Include Kubernetes OpenCost Allocations | Controls the Kubernetes Namespace grouping. OpenCost cost is an allocation of node cost your clouds already billed, so it is never added to billed totals in other groupings; a data note says so. |
| Include Azure Spend | Includes or leaves out Azure. |
| Net of credits / Excluding credits / Credits only | Net of credits is the default and matches what the provider invoices. A line Usage, Credits, Net appears under the notes when credits exist. |
| Saved filters | Reusable filters from the saved filters panel, applied to every query of the report, including scheduled emails. A deleted or no longer visible filter makes a run fail with a reason rather than silently report unfiltered numbers. |
| $ USD / € EUR / £ GBP | Report currency, shown top right. It follows your own preference and is kept when you load a preset. |
| Refresh | Runs the report again. |
How to read the page
Title block
The title shows the report name and, above it, the preset it started from. Beside it you see the Period, a Month to date pill when the period is not finished (with the last day that has data), what it is Compared with, and, when available, a Data as of time.
Executive summary
A short list of plain sentences built by CostGlass from the report's own numbers. It never guesses a cause. Typical bullets are: the total and how it changed, the biggest increases, the biggest decreases, how concentrated the spend is (the top three items and their share), the mix between clouds, a note if the latest period is incomplete, and a projection when one is available. Copy as text copies the list. Icons mark the kind of bullet: an up arrow for an increase, a down arrow for a decrease or saving, a warning triangle for something to watch, a chart arrow for a projection.
Data and rule allocation notes
A blue box that explains anything that affects how to read the numbers: a cloud missing from a daily view, Kubernetes cost not being added to totals, how many virtual tag rules were applied, or that a month-end figure is a projection. Read it before quoting a number.
Key figures
| Tile | Meaning |
|---|---|
| Total spend | Everything billed in the period, in the report currency. For an unfinished period it says "so far this period". |
| Change | Spend in the period minus spend in the comparison period, with an arrow and a percentage. Red means up, green means down. "no baseline spend" appears when the comparison period had no spend, because a percentage of zero is meaningless. The wording beneath says what it was compared with. |
| Daily run-rate | Average spend per day across the days the report covers. For an unfinished month it divides by the days that have happened, not the whole month. |
| Projected period end | Only for an unfinished month; see the forecast rules below. |
| Top driver | The single item with the biggest share of spend, with a bar showing that share. |
Spend over time chart
By default the chart is Stacked bars, one colour per cloud, one bar per day or month. The chart type switch also offers Lines and Share (treemap), where each box is a row of the table sized by spend. Click names in the legend to hide or show a series. An unfinished last bar is hatched and labelled MTD: it is still growing, so do not compare its height with a finished month. Hovering shows each cloud's value and the total. A hidden table version of the chart is provided for screen readers.
Breakdown table
One row per item of the primary grouping, ranked by spend. Click a row's arrow to open a detail panel with spend, prior spend, change, share, the identifier, a small history and an Open in Cost Explorer link.
| Column | Meaning |
|---|---|
| Cloud | The cloud or clouds the row came from, largest first. One row can list several clouds because items with the same name are merged. |
| Share | The row's percentage of total spend. |
| Trend | A small line of the row's spend over the period (up to 12 points). |
| Spend | What the row cost in the period. |
| Compared period | The current-side figure that the comparison actually used. It differs from Spend when part of the period was left out of the comparison (see below). |
| Prior period | The same item in the comparison period. |
| Variance | Compared period minus prior period, in money. |
| Change % | Variance as a percentage of the prior period. A dash for NEW rows. |
| Status | A pill: see below. |
| Identifier | The raw key (an account id, a region code). Hidden by default; switch it on in the column chooser. |
Table tools: Filter rows... searches names, identifiers and clouds; Group by cloud puts a subtotal header above each cloud's rows; the density button switches compact and comfortable rows; Columns chooses which columns show (your choice is remembered in this browser, and Reset columnsrestores the default); tick rows to use Copy selected; Copy TSV copies the table for pasting into a spreadsheet; the pager sets 10, 25, 50 or 100 rows. For very large results (over 500 rows) the table scrolls instead of paging.
Status pills and the plus or minus 2% rule
| Status | When it is shown |
|---|---|
| INCREASE | Spend rose by more than 2% against the comparison. |
| SAVINGS | Spend fell by more than 2%. |
| STABLE | Spend moved by 2% or less either way. |
| NEW | There was no spend in the comparison period but there is now. |
| REMOVED | There was spend in the comparison period but none now. The row still appears, at zero. |
| No pill | Neither side had any spend on the comparison basis, so there is nothing honest to say. |
Comparison basis, explained in plain words
A report that includes the current month has a problem: the month is not finished. Comparing 12 days of October with all of September would always look like a big saving, and it would be wrong. CostGlass avoids this and tells you which method it used, in the title block, the Change tile and the executive summary.
- full_periods (complete periods)
- Both sides are finished, for example Last Month against the month before, or a custom range against an equally long range just before it. Everything is compared as it stands.
- excluded_partial (leave the unfinished part out)
- The report spans complete months plus an unfinished one, for example Last 3 Months on 12 October. The variance compares the last complete months with the same number of months before them, and leaves October out of the comparison. The label reads like vs previous 2 months, excluding October 2026 (incomplete). Totals and the chart still include October. For a day-by-day report the comparison covers only days that have data, and today is excluded because it is still arriving.
- like_for_like_mtd (same days last month)
- The report is only the current month, for example Month to Date (MTD). Nothing finished exists to compare, so the first N days of this month are compared with the first N days of last month, using clouds that report daily spend. The label reads like vs same 12 days of September. If no daily data exists for that comparison the page says "No complete month to compare" and shows no variance.
On 12 October you run Month to Date (MTD). Total spend shows everything billed from 1 to 12 October. The Change tile compares those 12 days with 1 to 12 September, not with the whole of September, and the Compared period column shows the matching 12-day figure per row.
Projection rules
For an unfinished month CostGlass can project the month-end total: month to date plus the average of the last seven recorded days multiplied by the days left. It needs at least seven days of daily spend, so it is not shown for the first week or for groupings that cannot support it. It is labelled a projection, not a bill. When it is not available the chart note says why.
Cross-tab matrix and ranked variance
Choose a Secondary Matrix Dimension and the table becomes a grid with the primary dimension down the side and the secondary across the top, for example Service by Region, with row and column totals. The title reads 2D Cross-Tabulation Matrix. Row totals are the sum of the visible cells, so they always add up.
- Both dimensions must be different and be among Service, Region, Provider Account / Subscription and Charge Category (FOCUS). The secondary options are labelled Secondary: Provider Account / Subscription, Secondary: Region, Secondary: Service and Secondary: Charge Category (FOCUS).
- Monthly and Daily both work. In a daily grid, clouds that only report monthly totals are left out, and a note names them.
- Spend that a cloud does not attribute to an account at line level shows as (unspecified), with a note. This is common for AWS and Azure account totals.
- If the pair cannot be cross-tabulated, the page explains why instead of showing an empty grid.
Two buttons switch the view: 2D Matrix Grid shows the grid; Ranked Variance shows the one-dimensional ranked table with the status pills, so you can see what changed most. Variance compares the primary dimension only.
Special groupings
Kubernetes Namespace
Reads OpenCost data. OpenCost keeps only the latest snapshot, so the figures are not limited to the period you picked and there is no previous period to compare with. The page says so in a data note. If no cluster is connected, the note tells you to connect one under Kubernetes Costs. See Kubernetes Costs.
Virtual Tag
Allocates your billed cost by your own rules, applied to the stored cost lines. Rules that cannot be evaluated on billed cost are listed in a data note, and the spend they would have claimed lands under the tag's default value. With no tags defined the report is empty and says how to create one. See Virtual Tagging.
SaaS and AI providers
Groups real billed cost per provider, clouds and vendors side by side (OpenAI, Anthropic, Datadog, Snowflake and so on). Turning off the SaaS toggle removes the vendors. For detail inside the vendors, see SaaS & AI Spend.
Exports, link and print
The buttons sit above the controls. All exports use the report exactly as it is on screen, run with your data access.
| Button | What you get |
|---|---|
| Export to Excel (.xlsx) | A formatted workbook (details below). |
| Export CSV | One flat file for loading into other tools. |
| Export PDF | A short executive document, 1 to 4 pages. |
| Print / PDF | Opens your browser's print dialog on the page itself. Choose "Save as PDF" to keep a copy. Controls are hidden and a cover block with organisation, period, comparison and time is added. |
| Copy link | Copies a link that reproduces this exact report for anyone in your organisation. The address bar also updates as you change selections, so you can copy it straight from there. Links never contain a token; people must be signed in to your organisation. |
| Copy TSV | Copies the table (or the matrix) as tab-separated text to paste into a spreadsheet. |
What is inside the Excel workbook
The file is named like CostGlass_FinOps_Report_service_last-3-months_2026-10-12.xlsx. Tabs, in order:
| Sheet | Contents |
|---|---|
| Cover | A dark title banner with the report name and organisation, then Period (with dates), Comparison (label and basis), Granularity, Grouped by, Currency, Filters, Data freshness and Generated. An "Important" block lists the partial-period warning, any data notes and the billing-data disclaimer. |
| Executive Summary | Report parameters (time range, date bounds, prior comparison window, primary and secondary dimension, currency, granularity, data notes), six KPI cards (total spend, prior period spend, period variance, growth rate, daily burn rate, top cost driver), the Top 5 Spend Drivers table (rank, item, spend, share of total, growth versus prior), a surge alert when growth is high, and below them an "Executive Narrative" with the summary bullets and any projection. |
| Charts | Three native Excel charts that update if you edit the data: stacked "Spend by cloud per interval" (or "Spend per interval" with one cloud), a horizontal "Top 10 by spend" bar, and a "Share of top 10" doughnut with percentage labels. |
| 2D Matrix Pivot | Only when a secondary dimension is active. The grid with a row total column using SUM formulas and a column totals row. |
| Spend Breakdown | Columns: Rank, Dimension Name, Identifier / Key, Spend, Share %, Prior Spend, Variance Delta, Change %, Status, Notes / Metadata, Cloud. A frozen header, filters on the columns, data bars on Spend, red for increases and green for decreases in the variance columns, coloured Status text, and a TOTAL SUMMARY row whose totals, variance and change % are live Excel formulas. |
| Time Series | One row per item and one column per interval, with a total row. Present when the report has a time series. |
| Chart Data | The numbers behind the stacked chart, per interval and per cloud. |
| Raw Telemetry | Underlying records: Date Start, Dimension Type, Dimension Key, Dimension Name, Account Ref, Cost USD ($), Cost GBP (£). Present when raw records exist. |
| Notes & Methodology | Plain definitions of spend, variance, comparison window, partial period, run-rate, forecast, status, the Cloud column, formulas and charts, plus this report's own comparison basis and data notes, and a disclaimer that figures can be revised by the provider and are not an invoice. |
Every sheet is set up for printing: landscape A4, fit to one page wide, repeated header rows on data sheets and a footer reading "Generated by CostGlass" with the sheet name and page numbers.
CSV columns
UTF-8 with a byte order mark, so Excel reads accented names correctly. One header row, then one row per item.
The currency code in the brackets follows the report currency. Partial Period is true or false and Comparison Basis is one of the three methods above, so a machine reader can tell how to treat the row. Numbers are plain decimals with no currency symbols.
PDF contents
- Title, organisation, and a block with Period, Comparison, Currency, Filters, Data freshness and Generated.
- A red warning if the period is unfinished.
- Four key figures: total spend, comparison spend, change (with percentage) and daily burn rate, plus the top cost driver.
- The executive summary (up to 14 lines).
- A stacked spend chart (the latest 24 intervals), a table of top movers against the comparison, and a Top 15 by spend chart and table. Further items are pointed to the Excel or CSV export.
- A closing Notes and methodology section.
Report library: save, folders, share, pin
Open the Report library card (click Show) above the filters. It keeps the settings of a report so you can reopen it, share it or schedule it.
| Action | What it does |
|---|---|
| Open | Applies the saved settings to the page. |
| Send to me | Emails the report to your own address, calculated with your own access. At most once every 30 seconds. |
| Duplicate | Makes a copy you own. Useful for adapting a shared report. |
| Schedule | Sets up emails (see below). Only for reports you own. |
| Rename / move | Rename, change folder, change sharing, or tick Replace this report's settings with the ones on screen to update it. |
| Delete | Removes the report and its schedule, after a confirmation. |
| Star icon | Pins the report to the top under "Pinned". Only the owner can pin. |
| Folder buttons | Filter the list by <UI>All</UI>, a folder name or <UI>No folder</UI>. The search box searches saved reports. |
- You can keep up to 100 reports of your own and have up to 20 scheduled reports.
- Names must be unique among your own reports.
- A shared report carries its settings only. Whoever opens it runs it with their own data access, so they see only what they are allowed to see.
- Saved settings can use a Service, Provider Account, Region, Kubernetes Namespace, Virtual Tag or SaaS & AI Provider grouping. Reports grouped by Usage Meter or Charge Category, or with a Charge Category secondary grouping, cannot be saved at present.
Scheduled delivery
Click Schedule on a saved report. The dialog is titled with the report name.
| Setting | What it does | Options |
|---|---|---|
| How often | How frequently it is sent. | Every day, every week, or monthly on the 1st (UTC). |
| Day | For weekly schedules only. | Monday to Sunday, in your local time zone. |
| Time | The hour to send. | On the hour, shown in your time zone. CostGlass sends at the matching hour in UTC and tells you which. |
| What to send | The email contents. | Summary email + Excel file, Summary email + CSV file or Summary email with a link only. |
| Recipients | Who receives it. | Active members of your own organisation, up to 10. |
| Schedule is on | Pause without deleting. | On or off. |
| Remove schedule | Stops and deletes the schedule. |
Rules that protect your data
- The summary email contains the total, the change, the daily burn, the top driver and the top rows, with a button that opens the report in CostGlass. If a file would be larger than 7 MB, the email falls back to the link only.
- The report is calculated as the person who created the schedule, with their own data access. Recipients must be able to see at least the same data: people limited to a different part of the organisation are rejected.
- You cannot email anyone outside your organisation.
- Each run claims its time slot before sending, so a slot is never sent twice.
- If a saved filter was deleted, or the report cannot be calculated, the run fails and says why instead of sending unfiltered numbers.
Slack and Teams digests
The schedule dialog can also include Slack or Microsoft Teams channels. A compact digest of the report is posted to them on the same schedule. A schedule needs at least one email recipient or one chat channel.
Run history (owners and admins)
Click Run history in the library to see a log of the last 100 events: When, Report, What (Download, Scheduled email or Email to self, with the format, row count and recipient count), By and Result (sent, or failed with the reason). The log holds no report data.
Recipes
- Click the Executive Board Pack & MoM Variance preset.
- Change Time Range Period to Last Month so the period is complete.
- In the library choose Save current report, name it "Board pack", folder "Board", and tick sharing if the finance team should open it.
- Click Schedule: Monthly, on the 1st (UTC), an hour of your choice, Summary email + Excel file, and tick the recipients.
- Click the Virtual Tagging & Squad Chargeback preset (or set Virtual Tag / Squad Allocation and pick the tag).
- Leave the range on Month to Date (MTD). Read the Status column: it compares the same days of last month.
- Use Export CSV for finance.
- Click Daily Burn Rate & Peak Spike Analysis.
- Look at the stacked bars for a tall day, hover to see which cloud drove it.
- Open the top service's detail panel and click Open in Cost Explorer to explore that service by region.
Click Copy link and paste it to a colleague in the same organisation. They see the same preset, period, grouping and filters.