Tag Explorer
Group billed spend by the value of a tag, see tag coverage per cloud and drill into resources.
Tag Explorer
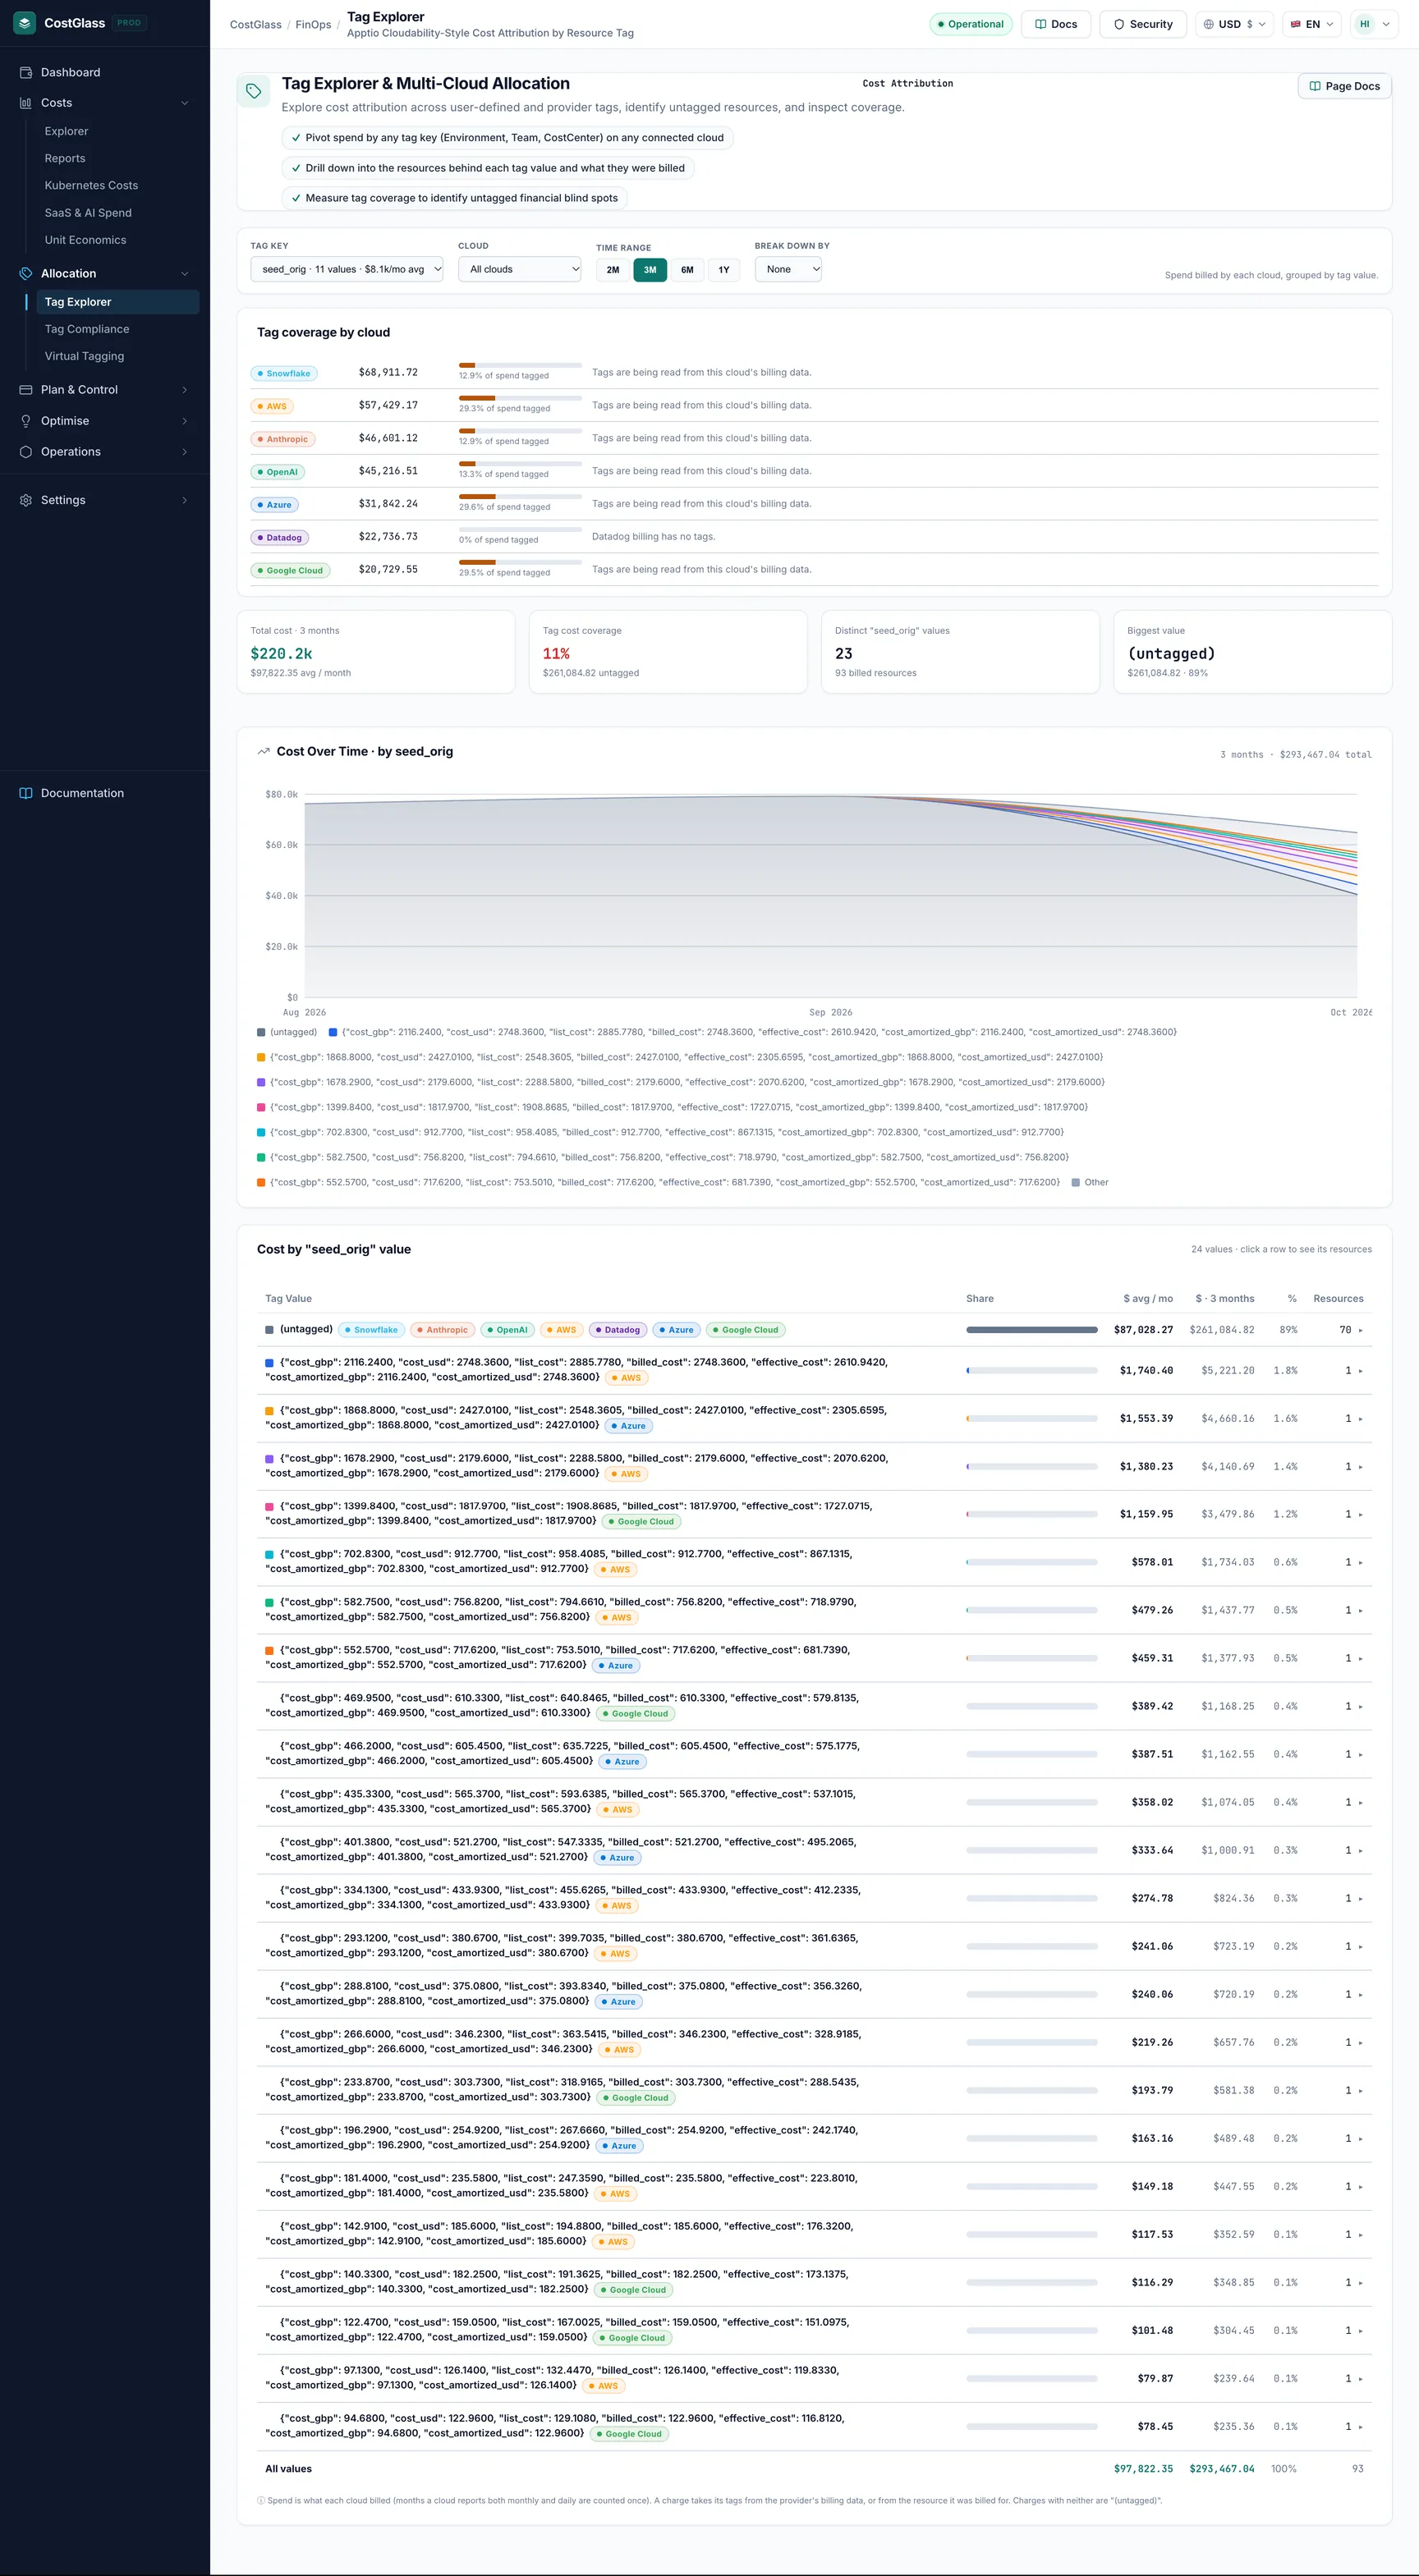
See what each cloud billed, grouped by the value of a tag, and find out how much of your spend has no tag at all.
- Pick one tag key, such as team, and Tag Explorer shows spend for each value of it, month by month and in a table. Choose No tag to group by cloud, service, region or account instead.
- Everything is billed cost, not an estimate. Nothing is modelled.
- The "(untagged)" row is spend that carries no value for that key. Its size is your tag coverage.
- Choose any dates with the same date selector as Cost Explorer. Click a value to see the resources behind it.
- Required tags come from your tag policy (set in Tag Compliance), and spellings of one value ("Data-Platform", "data_platform") can be merged once and remembered, without changing anything in your cloud.
- Tags reach CostGlass for AWS and Oracle Cloud today. A panel at the bottom of the page says what is available per cloud.
- At least one cloud connected with billed spend in the period you choose.
- Tags on your resources. On AWS the tags must be activated as cost allocation tags and be in your Cost and Usage Report. See the Tagging strategy guide.
How it works
Each charge on your bills takes its tags from the first place that has them:
- The charge itself, when the cloud's billing data carries tags (Oracle's cost report does).
- Otherwise the tags on the resource the charge was billed for, taken from CostGlass's resource inventory (this is how AWS Cost and Usage Report charges get their tags).
A charge with neither is shown as (untagged). Tag keys are matched without regard to case, so Team and team are the same key here.
The controls
| Control | What it does | Options / default |
|---|---|---|
| Date selector | The period to analyse. It is the same selector as in Cost Explorer: presets or a custom From and To date. | Last 6 Months (default), Last 7 or 30 Days, Current Month, Last Month, 3M, 12M, Year to Date, Custom |
| Group by tag | The tag to group by. It is optional: choose No tag to group by the Then by option alone. Each entry shows how much of the spend in view carries that key, and your required tags are always listed. | No tag, or a key found in the period (the first key is chosen at first) |
| Then by | With a tag chosen, a second grouping inside each tag value, shown when you expand a row. With No tag it is the grouping itself, so Provider shows spend per cloud. | Provider (default), Service, Region, Account, and None when a tag is chosen |
| Search | Matches resource ids, service names and tags (for example team=data-platform). | Empty |
Selecting a different tag, grouping or search updates the chart, the cards, the table and the resource list together. Chart bars are always whole months. Clouds that only report monthly totals are shown for the whole month even when your dates start or end part-way through one, and the page says so.
Explore your spend by tag
team (or leave it on No tag). You can also click a key in Tag coverage by key.How to read the page
The four cards
| Card | Meaning |
|---|---|
| Spend in view | Billed spend in the period, and the number of distinct billed resources. |
| Tagged with [key] | The share of that spend that carries a value for the chosen key, and how many different values exist. |
| Missing [key] tag | Spend that carries no value for the key, so it cannot be shown back to an owner. |
| Fully tagged spend | The share of spend that has every tag in your tag policy. If no required tags are set the card says so and links to Tag Compliance. |
Monthly cost by tag value
A stacked bar chart by month. The eight biggest values each get a colour; everything else is folded into a grey Other segment, and Untagged is red. Hover a bar to see each value's amount for that month. Tag coverage by key beside it shows, for every key, the share of spend carrying it and which keys are Required.
Cost by "[key]" value
| Column | Meaning |
|---|---|
| [key] | The value. A "merged" badge means other spellings are included (see Tag hygiene below). |
| Resources | Number of distinct billed resources with this value. |
| By provider | A bar coloured by cloud showing where the value is spent. |
| Cost | Total billed spend over the period, in your display currency. |
| Share | Share of the spend in view. |
| vs previous | Change against the previous period of the same length. Only complete calendar months are compared, so a month still in progress is left out. When the range has no complete month the column shows a dash. |
Drilling into a value
Expanding a row shows the split by provider, the second grouping you chose in Then by, the largest resources behind the value and, for a merged value, the spellings merged into it. The Resources list at the bottom of the page shows the most expensive resources in view with their tags; click a tag to filter the page by it. A required tag a resource lacks is shown as a dashed red chip, for example cost-center missing. Show more loads the next 15.
Required tags
The tags marked Required come from your tag policy, the same one you edit in Tag Compliance. They drive theFully tagged spend card, the box at the bottom of the hygiene panel that says how many resources, and how much spend, are missing a required tag. If no policy has been set, no tag is marked required.
Tag hygiene and merging spellings
Teams rarely spell a tag value the same way everywhere: data-platform, Data-Platform and data_platform are one team but three rows.Tag hygiene finds values that differ only by capital letters, spaces, underscores or hyphens and shows what each is costing you.
- Click Merge into "…" (the spelling with the most spend is suggested) and confirm.
- From then on those spellings are shown together as one value, with their cost added up, on every visit and for everyone in your organisation.
- To undo it, expand the merged row and click Unmerge next to a spelling.
Tag coverage by cloud
Open Tag coverage by cloud at the bottom of the page. For each cloud it shows the billed amount, the share that could be tagged, and a note. If a cloud shows 0% with a note saying tags are not read, that is a limit of the billing data, not something you did wrong (for example "Azure's cost export does not carry resource ids or tags yet" or "Cloudflare billing carries no tags"). See Tagging strategy for the full list of which clouds' tags reach CostGlass.
Working with untagged spend
To see the untagged spend, expand the Untagged row to see which resources have no value for this key. Then either tag them in your cloud (AWS owners can use Tag Compliance) or allocate them with a virtual tag.
You choose team over the last 6 months. Coverage shows 62%, and "(untagged)" is the second biggest row. You expand it and see two large database resources and a set of storage buckets. You ask their owners to add the tag, and next month coverage moves towards green.
If the page is empty
- "No tags found on your billed spend in this period": spend exists but none of it carries a tag. Open Tag coverage by cloud for the reason per cloud.
- "No billed spend was found for these dates": try a longer range, or connect a cloud.
- "Nothing matches these filters": clear a filter or widen the dates.
- "Could not load your tags": try again in a moment.
Good to know
- Money is shown in your selected display currency. Spend a cloud reports both monthly and daily is counted once.
- Export view downloads the value table as a CSV file.
- If you are limited to part of the organisation (see organisation hierarchy), you only see spend for the accounts you can access.
- The Cost Explorer's Tag: … grouping is separate. It reads live AWS Cost Explorer data and needs a role-based AWS connection.