Unit Economics
Cost per business unit: define metrics, send volumes, set targets and alerts.
Unit Economics
Divide your recorded cloud spend by a number from your own business, such as orders, users or API calls, to see what one unit really costs and whether that is improving.
- A unit cost is cloud spend divided by a business volume you supply. It tells you whether you are getting more efficient as you grow, which a total bill cannot.
- You define a metric (for example "Orders"), choose which spend to divide by, and send CostGlass a volume per day.
- CostGlass only calculates for days that have both recorded spend and a recorded volume. Nothing is seeded or invented.
- Set a target and CostGlass emails owners and admins if the unit cost goes more than 5% over it.
- See the trend, a straight-line projection, and where the cost comes from by cloud, service or account.
The idea
Your cloud bill goes up when your business grows, and that is fine. The useful question is whether it goes up faster than the business. Unit economics answers that by dividing spend by a measure of value.
Suppose, for example, in one month you spend 20,000 and handle 1,000,000 orders. The cost per order is 0.02. Next month you spend 24,000 and handle 1,500,000 orders: the bill is 20% higher, but cost per order fell to 0.016. That is a healthier business, and only a unit cost shows it. (These numbers are illustrative.)
- Metric
- A business measure you define, such as "API requests", "Monthly active users" or "Orders". It has a name, a unit label and a cost scope.
- Volume
- The number for one day, for example 52,000 orders on 1 September. You supply these.
- Cost scope
- Which part of your spend to divide by the volume: all spend, only compute, or only databases.
- Unit cost
- Spend divided by volume, over the days that have both.
- Target
- The unit cost you want to stay under. Optional.
Before you begin
- At least one cloud connected and synced, so CostGlass has recorded spend. Without it the page says "No cloud cost has been recorded yet".
- A business number you can supply per day, from your own system (a database count, an analytics export, a billing report).
- An owner or admin account to define metrics, add volumes and set targets.
Define a metric
Cost scopes
| Option on screen | What is divided by the volume |
|---|---|
| All cloud spend | Everything recorded, across every connected cloud and vendor (Kubernetes allocations are excluded because they re-split cost already billed). |
| Compute only | Compute and container services. |
| Databases only | Database services. |
Credits and refunds are left out of unit cost. It measures what the business consumed, so a promotional credit ending must not look like the unit cost rising.
Send volumes
Select the metric button, then click Add volume. The dialog Add business volume has three tabs. Whichever you use, there is one volume per metric per day; sending a day again replaces the earlier value.
Enter a day
Choose the Date and type the Volume, then Save datapoint. Volumes are zero or more, and can be decimals.
Import a CSV
Use Import a CSV to choose a file, or paste rows into or paste rows here, then click Import.
| Rule | Detail |
|---|---|
| Columns | A date and a value, one row per day. |
| Date format | YYYY-MM-DD. A time after the date is ignored. Slashes are accepted in place of hyphens. |
| Header row | Optional. If present, CostGlass looks for a date column named date, day, ds, timestamp or time, and a value column named value, volume, metric_value, count, amount, total or units. Otherwise it uses the first two columns. |
| Separator | Comma, semicolon or tab. |
| Values | Zero or more. Spaces inside numbers are removed. |
| Limits | Up to 5,000 data rows and 2 MB, in UTF-8. Larger files are refused: split them. |
| Repeated date | The last row for that date wins. |
| Problems | A bad row is skipped, not the whole file. The result says "Imported N days, skipped M" and lists the first few problems by row number, for example "Row 3: '2026-13-40' is not a date". |
From your own systems
The From your systems tab shows a ready-made request. Send up to 5,000 days at once, as JSON. The request needs the sign-in token of an owner or admin; there is no separate API key for this yet. Replace the metric id with the one on screen and the token with your own.
/v1/unit-economics/telemetry with metric_id, date and metric_value. A request that names a metric from another organisation is rejected as not found.Reading the page
Status and 'Getting started'
The Getting started card shows while you have no metrics or no unit cost yet. Its last line reports what cost data exists: Daily cloud cost is recorded up to a date, or that your clouds report monthly totals only, or that no cost exists yet.
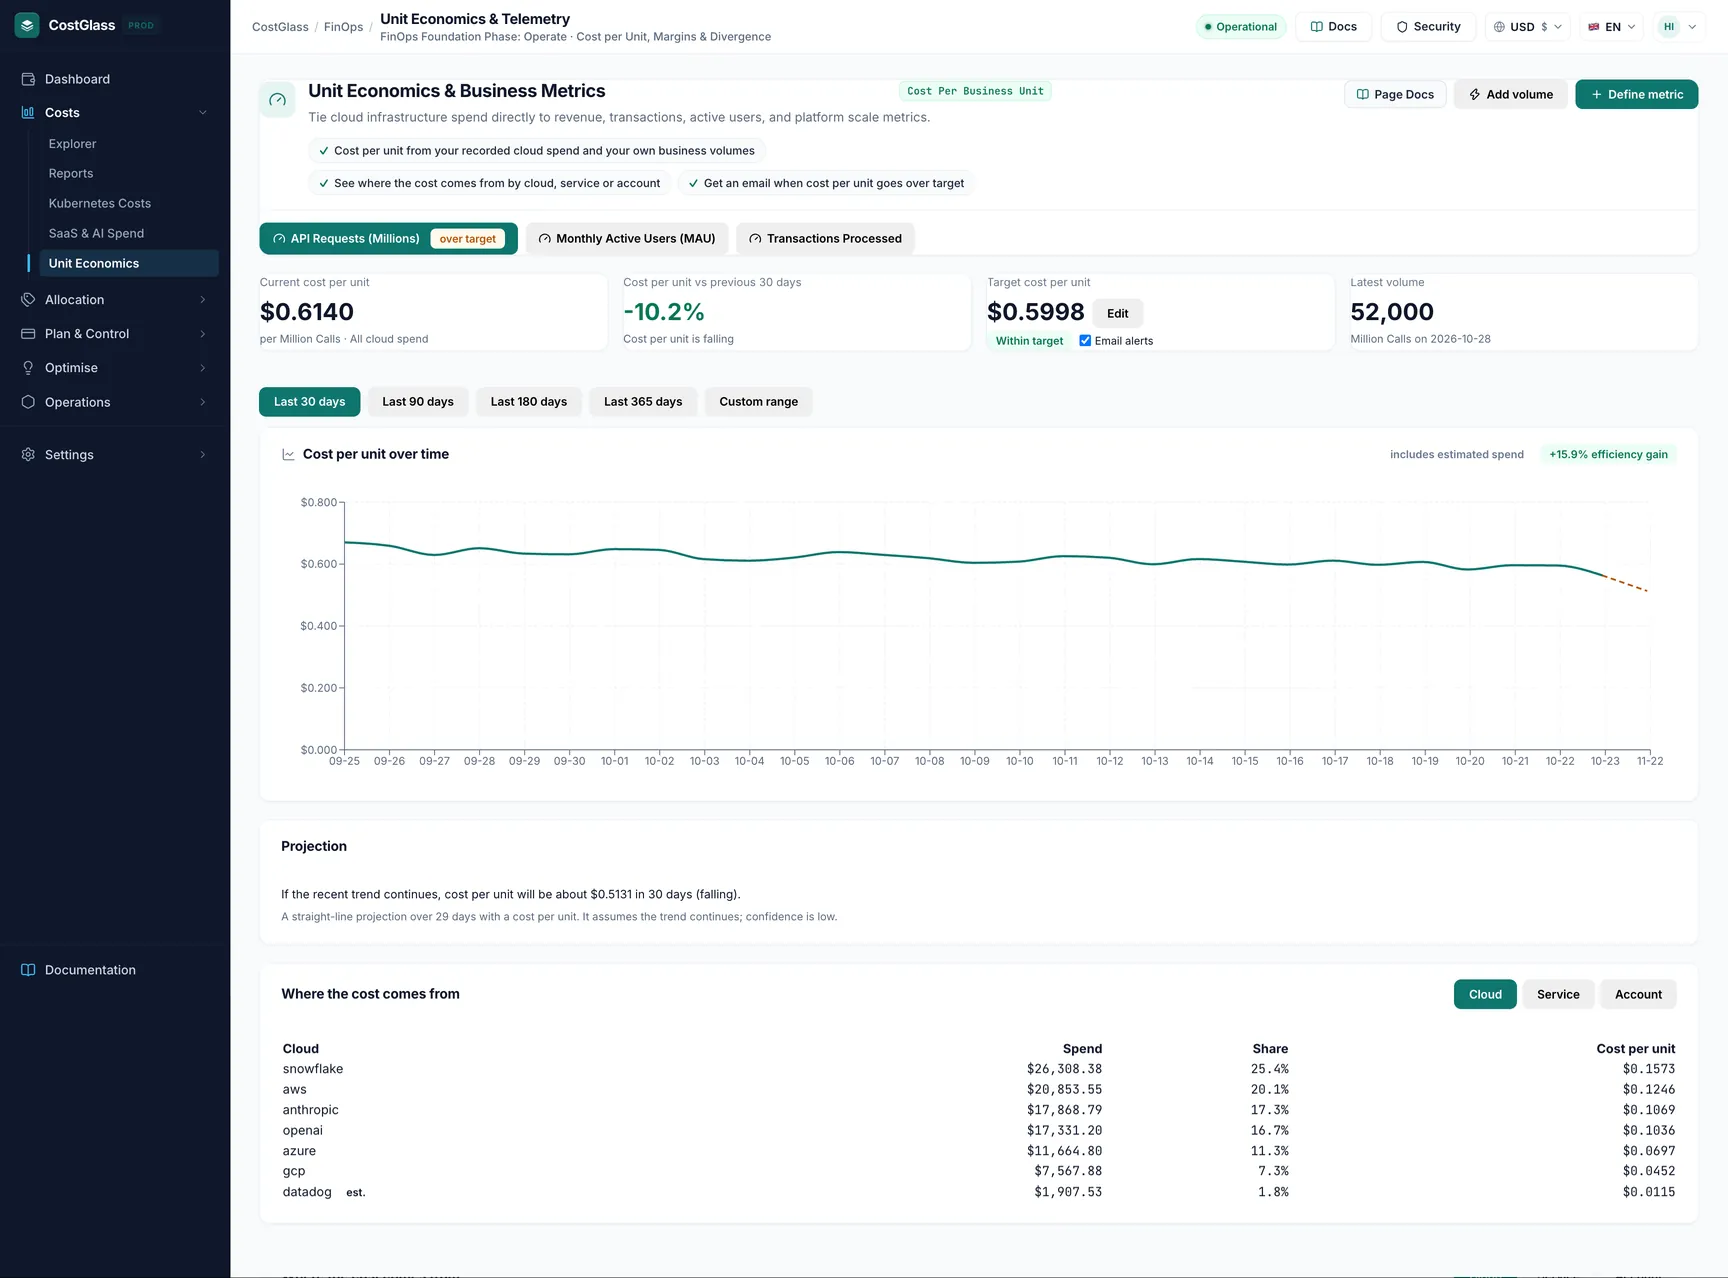
The four cards
| Card | Meaning |
|---|---|
| Current cost per unit | The last 30 days up to your latest volume, spend divided by volume over days that have both. Shown with the unit, for example "per 1k queries · All cloud spend". Shows a dash with "Needs volume and recorded cost for the same days" until it can be calculated. |
| Cost per unit vs previous 30 days | The percentage change against the 30 days before that. Green when falling, amber when rising. "Needs 60 days of data" until enough history exists. |
| Target cost per unit | Your target, an Edit button, a status pill and the Email alerts tick. The pill reads Within target, Over target, No target set or No data yet. |
| Latest volume | Your most recent volume and its date. |
A metric that is over target also carries a small over target tag on its button at the top.
Cost per unit over time
Choose a range with Last 30 days, Last 90 days, Last 180 days, Last 365 days or Custom range (From and To, up to two years). The blue line is the actual cost per unit for each day. If enough history exists a dashed amber line extends the trend into the future. A green efficiency gain pill shows how much cheaper a unit is now than at the start of the range. A pill includes estimated spend warns when some days use monthly totals spread over a closed month (see spend basis).
A day with a volume but no spend still counts as a volume day; its unit cost is simply blank. If volumes exist but no cost does, the page says "Volumes are recorded, but there is no cloud cost for those days yet".
Projection
The Projection card says what cost per unit will be in 30 days if the recent trend continues, and whether it is rising, falling or flat, and warns That is above your target when relevant. It is a straight-line fit of the daily unit costs. It needs at least 14 days that have a unit cost, and its confidence is shown as low (under 30 days) or medium. Treat it as a nudge, not a forecast: it assumes nothing changes.
Where the cost comes from
Buttons Cloud, Service and Account choose the grouping. The table lists each group with Spend, Share and Cost per unit. The groups' unit costs add up to the metric's overall figure for the range. At most 24 groups show; the rest are folded into (other). An est. tag marks a group that includes spread monthly spend. Use it to find which cloud or service moves your unit cost.
What 'spend basis' means
Most clouds report daily spend. A few report only monthly invoices. CostGlass handles this honestly:
| Spend basis | Meaning |
|---|---|
| daily | Every day used real daily spend. |
| mixed | Some days used real daily spend; others used a monthly total spread evenly over the days of a closed month, and are flagged estimated. |
| monthly_spread | Only monthly totals exist. Each closed month is divided evenly across its days. These days are flagged estimated. |
| none | No cost was available. |
Targets and alerts
| Rule | Detail |
|---|---|
| What counts as over target | The unit cost is more than 5% above the target. A unit cost within 5% of the target is still shown as within target. |
| Who is emailed | The owners and admins of your organisation. |
| How often | One email when the metric crosses the target, a reminder at most once a week while it stays over, and nothing while it is fine. |
| When it checks | About every 6 hours. |
| Resetting | Changing the target or switching alerts back on starts fresh: the next check decides whether it is over. |
| Subject line | "[CostGlass] Cost per <unit> is over target: <metric name>". |
| Scope | The alert looks at your whole organisation, not at any one user's part of it. |
Recipes
- Click Define metric, name it "API calls", unit "1k calls", scope Compute only.
- Export daily request counts from your gateway, divide by 1,000, and save them as a CSV with a
date,valueheader. - Add volume then Import a CSV.
- After a few weeks, read Cost per unit vs previous 30 days and the projection.
- Open the metric and set the range to Last 90 days.
- In Where the cost comes from click Service, then Account.
- Compare the shares with last quarter's, then open the service in Cost Explorer.
Run a nightly job that posts yesterday's volume to the bulk request above using an owner or admin token, so the metric stays current without anyone uploading files.
Limits to be aware of
- You cannot yet rename or delete a metric, or edit or delete a single datapoint, from the page. You can overwrite a day by sending it again.
- The request for volumes needs a sign-in token; a dedicated API key for this is not available yet.
- Cost scopes are three: all spend, compute and databases. The compute and database split by service name is approximate.
- The projection is a straight line and needs 14 days with a unit cost.
- Alerts are email only and cover the whole organisation.
- Kubernetes allocations are never added to spend here, to avoid counting node cost twice.