Uptime, incidents & support requests
Monitor public endpoints, route alerts, see incidents and raise requests to CostGlass engineers.
Uptime, incidents & support requests
Watch your public endpoints, get alerted when they fail, see recorded incidents, and ask CostGlass engineers for help.
- Uptime sends an HTTP request to each public URL you register and records status, response time and certificate expiry. In production the check runs about every five minutes.
- A check passes only on a 2xx response within 5 seconds. Anything else marks the service Degraded and triggers an alert.
- Alerts go to Slack, PagerDuty, Microsoft Teams or email, by environment category or per service.
- The Incidents page lists open incidents recorded for your organisation. CostGlass does not raise them automatically from failed checks, and the page has no create button.
- Support & Requests is your desk to CostGlass engineers: raise a task, bug, feature request or question and track it.
- A Growth, Scale or Enterprise plan. The Uptime menu item is greyed out below Growth.
- Owner or admin role to register services, change categories or channels.
- A public HTTP or HTTPS URL that returns a 2xx status when healthy, such as /health, /healthz or /status. It should be safe to call repeatedly.
- For alerts: a Slack incoming webhook, a Teams webhook, a PagerDuty integration key, or an email address.
What Uptime can and cannot monitor
Uptime is a synthetic check: CostGlass makes an HTTP GET to the URL you give it and judges the answer. It can only monitor public HTTP/HTTPS endpoints. A Lambda function, an RDS database or a Kubernetes workload with no URL cannot be watched this way; for the state of those, use Cloud Resources. A page card on Uptime says the same and links to the discovery templates.
Uptime: category notification rules above, monitored services below.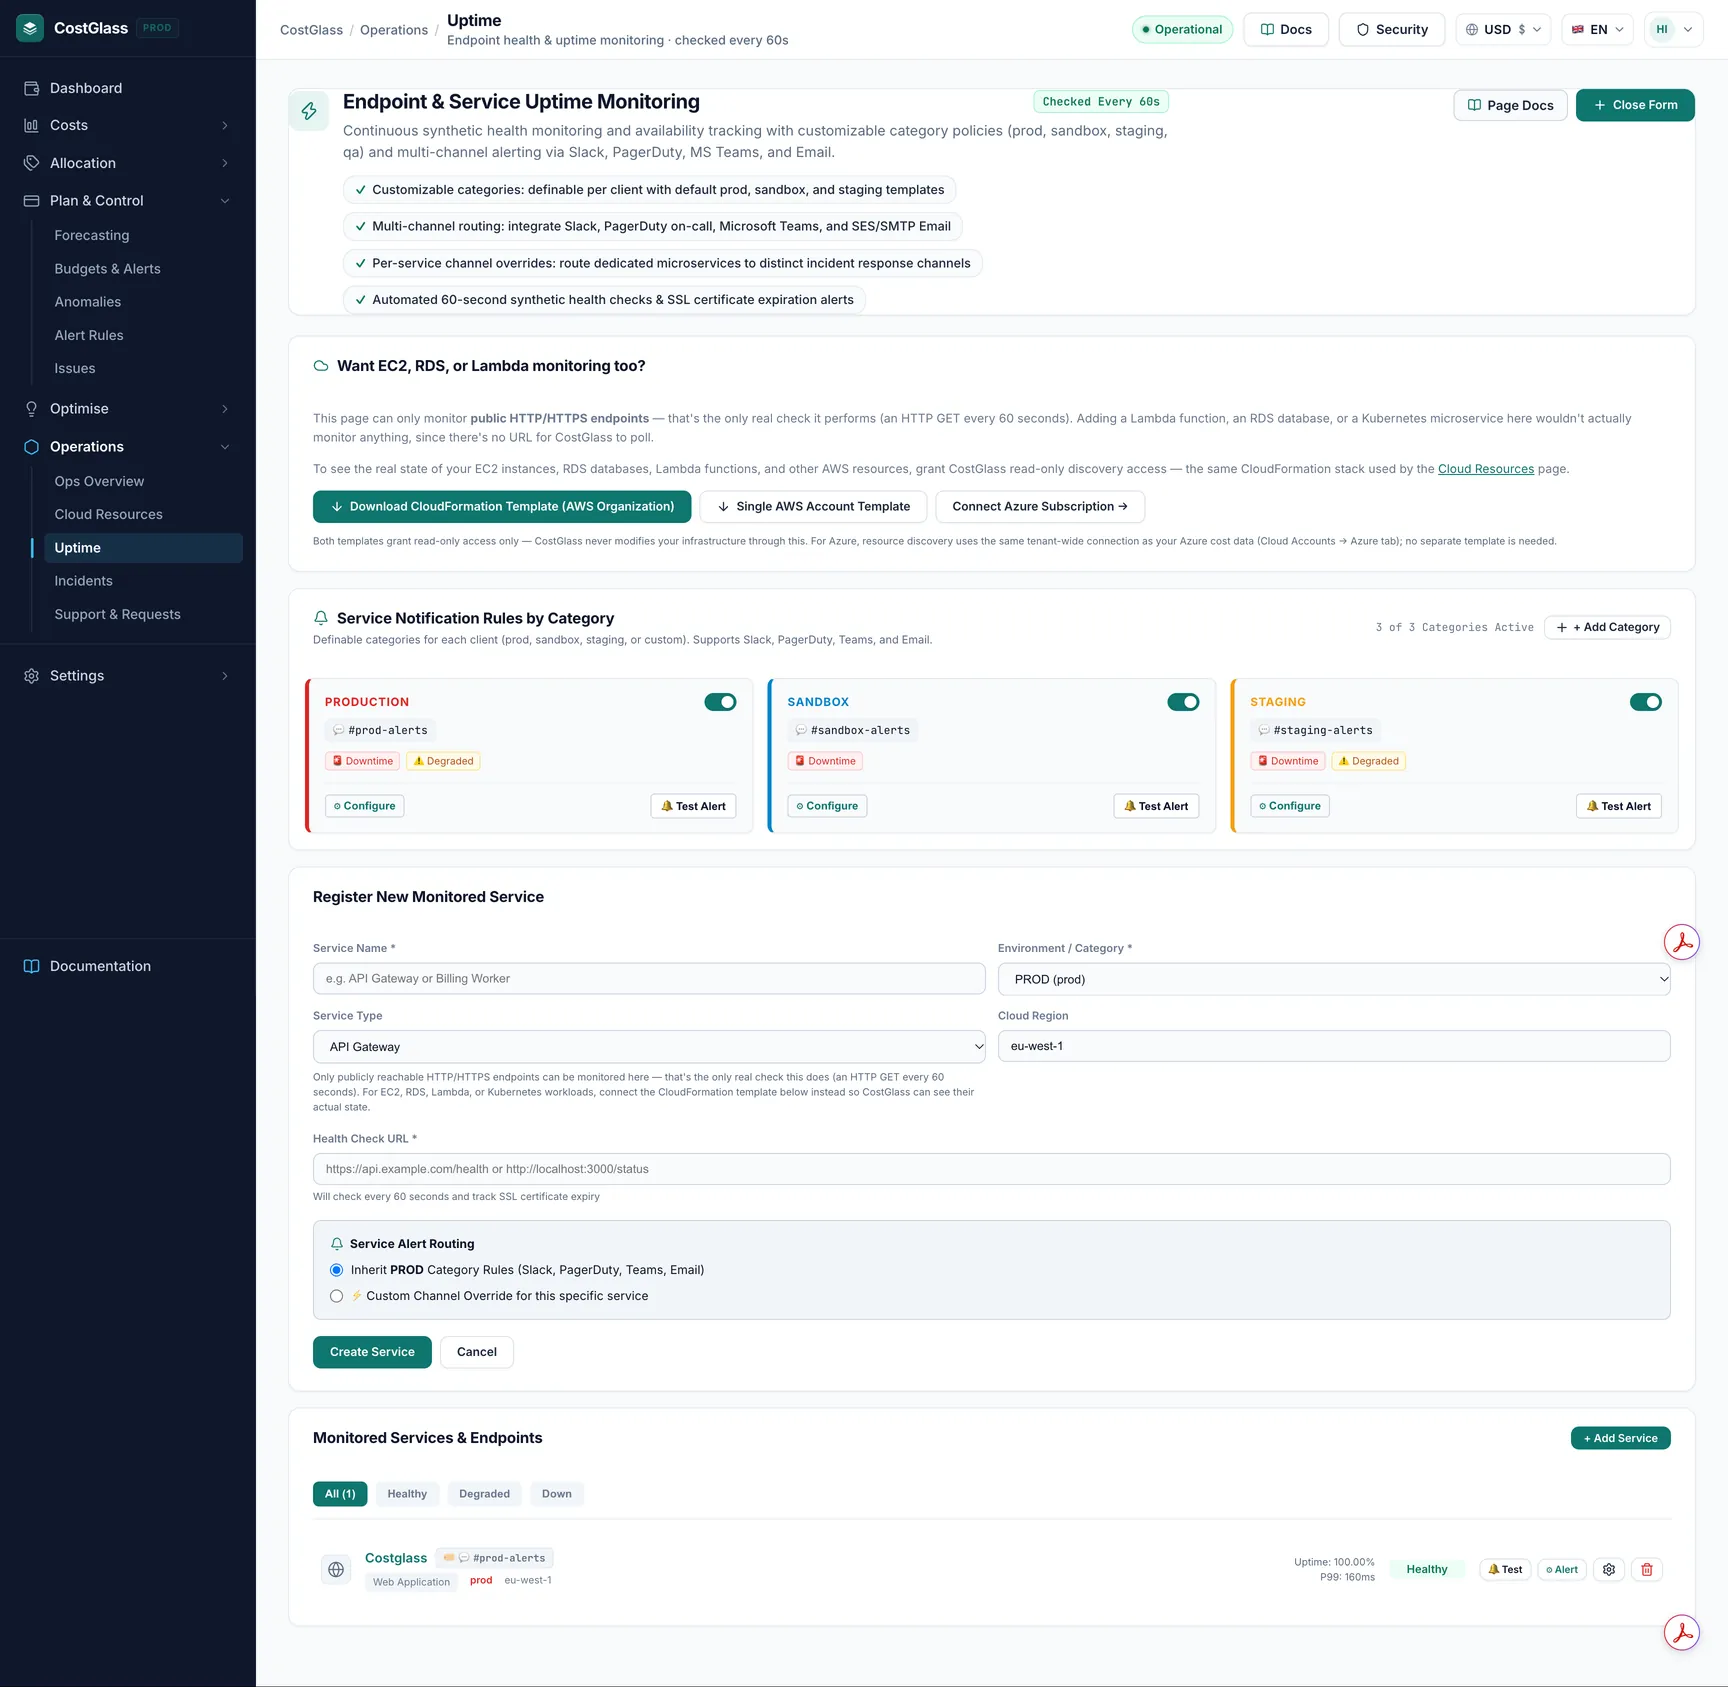
| What is recorded | Detail |
|---|---|
| Status | Healthy when the response is 2xx; Degraded otherwise (including timeouts and connection errors). Redirects are followed. |
| Latency | Response time of the last check. Shown as P99 on the service row. |
| SSL | Days until the HTTPS certificate expires. The row turns amber then red as it approaches. |
| Uptime % | A running figure that rises by 0.01 for each successful check and falls by 0.05 for each failure, between 0 and 100. It is a trend indicator, not a true 30-day availability calculation. |
Add a service
https://api.example.com/health. Without a URL the form refuses to save.The service list has filter buttons for all, healthy, degraded and down, and per row: 🔔 Test, ⚙ Alert, edit and delete (with confirmation). Click a service for its detail page: Current Status, SSL Expires In, Response Latency and Service Status charts. New services need a few checks before charts fill in.
Alert channels
Category rules
Service Notification Rules by Category defines default channels per environment (prod, sandbox, staging, or categories you add with + Add Category). Each category can be enabled or disabled, shows No channels configured or Silent when nothing is set, and can notify on degraded and down states. Custom categories can be deleted.
Per-service override
Click ⚙ Alert on a service and choose Select Alert Routing Behavior: inherit the category's channels, or Custom Alert Channels Override for this specific service. Add destinations with the Slack, PagerDuty, Teams and Email buttons, and send a test to each.
| Channel | You provide |
|---|---|
| Slack | A channel name and/or an incoming webhook URL (https://hooks.slack.com/…). |
| PagerDuty | A 32-character integration key. |
| Microsoft Teams | A Teams or Workflows webhook URL. |
| One or more addresses. |
- Webhook URLs and keys are write-only: after saving you see only the last few characters, and leaving the field blank keeps the saved value.
- Webhook hosts are checked against an allow-list of the real Slack and Teams hosts; anything else is rejected.
- Test emails always go only to your own address, whatever recipients are configured. Real alerts go to the saved recipients.
- A PagerDuty test creates a real incident in PagerDuty.
- Only owners and admins can change categories and channels, and a service with nothing configured cannot be tested.
Honest limits of alerting
- The checker marks failures as Degraded; the Down filter exists but a failed check does not currently produce a separate Down state.
- Only HTTP checks (and Kubernetes deployment checks for services linked to a cluster) are performed.
- Saved channel secrets for individual services are kept in the database; anomaly-rule secrets are held in a secrets store.
Incidents
Incidents (titled Production Incident Management) shows open incidents as cards with title, description, severity P1 to P4, status and start time, or No open incidents with an All Clear badge.
| Severity | Colour | Meaning |
|---|---|---|
| P1 | Red | Most severe. |
| P2 | Amber | Serious. |
| P3 | Blue | Moderate. |
| P4 | Green | Minor. |
The Ops Overview cockpit summarises services online, discovered assets, open incidents and your active requests.
Support & Requests
Raise anything you need from CostGlass: DevOps/SRE work, a feature request, a bug report or a question. Open Support & Requests and click + New Request.
What happens after you submit
- Email goes to the engineers assigned to your organisation and to the CostGlass platform operators, linking to the request in the Back Office for your region.
- You receive an acknowledgement email. If your account has no email address on file, there is nothing to send.
- When an engineer is assigned, they are emailed. When the status changes, you are emailed.
- Email problems never stop the request being saved.
Reading the page
The KPI strip shows Active Requests, SLA & Resolution, Assigned SRE Bench and Completed Tasks. Tabs filter by All, In Progress, Open and Completed; a priority drop-down and search narrow the list. Statuses are Open, In Progress, Waiting Review and Completed.